Fig. 2.

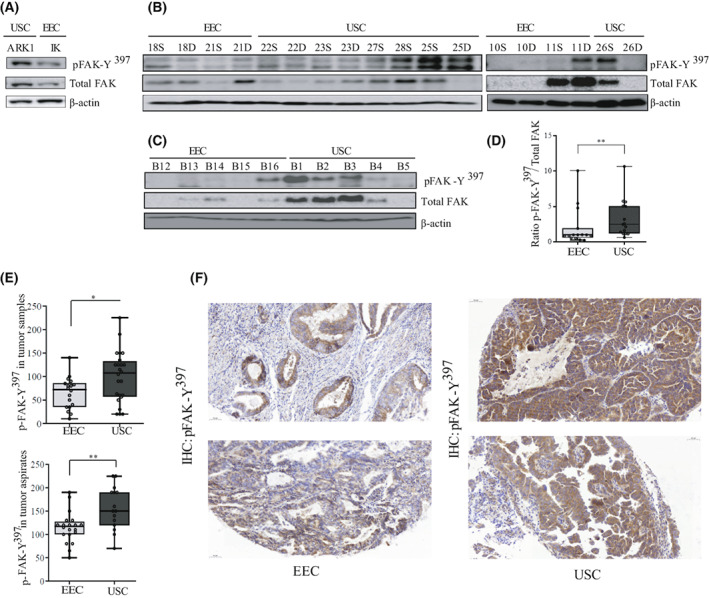
Enhanced FAK activation in USC cell lines, aspirates, and tumor samples compared to their counterparts. (A) Representative western blot analysis of p‐FAK‐Y397 and total FAK levels in ARK‐1 USC and Ishikawa (IK) EEC cell lines (n = 3 independent experiments). β‐actin was used as a loading control. (B) Representative western blot of tumor samples used for the Kinome analysis. A total of 18 EEC and USC samples corresponding to either the superficial part (S) or the deep (D) part of the tumor, were processed under native conditions and analyzed for p‐FAK‐Y397 and total FAK levels. n = 3 independent experiments. β‐actin was used as a loading control. (C) Ten independent samples corresponding to five EEC tumor samples and five USC samples were processed under native conditions to corroborate previous results. (D) Values of p‐FAK‐Y397/total FAK ratio levels between all EEC and USC samples used in B, presented as median ± CI (n = 3 independent experiments). Mann–Whitney U‐test (**P = 0.007). (E) p‐FAK‐Y397 staining in tumor samples and tumor aspirates was calculated by a histoscore method (being 250 points the maximum immunoreactivity), and values are median ± CI (n = 3 independent experiments). Statistical analysis was performed to assess differences in p‐FAK‐Y397 staining between EEC and USC tumors and aspirates using Mann–Whitney U‐test. Both USC tumors and aspirates show a significant higher expression of p‐FAK‐Y397 levels compared to their EEC counterparts (*P = 0.03 and **P = 0.006, respectively). (F) Representative images of p‐FAK‐Y397staining in two EEC and two USC samples. Scale bar: 50 μm, 20× magnification.
