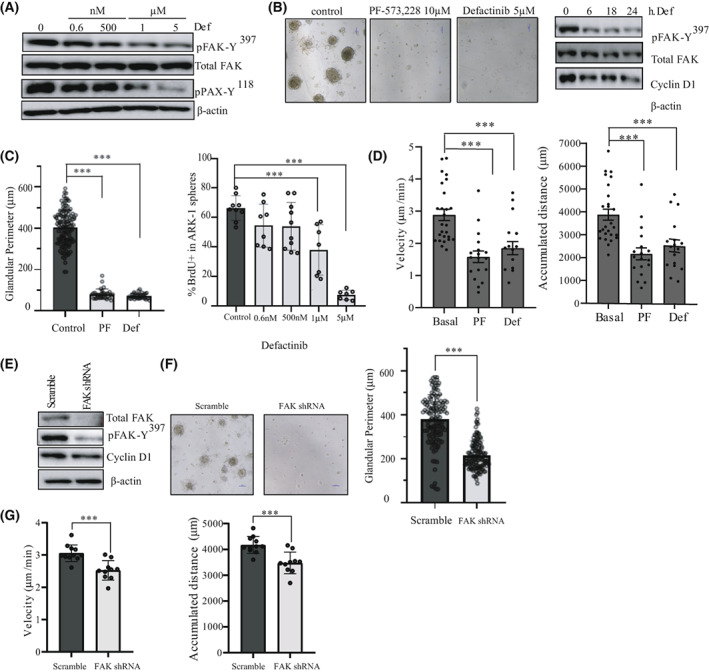
Fig. 3.

FAK activation controls cell growth and migration in USC cell lines. (A) Representative western blot of p‐FAK‐Y397, total FAK, and pPAX‐Y118 levels in ARK‐1 cells treated with 0.6 nm, 500 nm, 1 μm, and 5 μm of defactinib for 1 h (n = 3 independent experiments). β‐actin expression is used as a loading control. (B) Representative phase contrast images of ARK‐1 3D cells treated with 10 μm PF‐573228 or 5 μm defactinib for 48 h (n = 3 independent experiments). Magnification 10×. Scale bar: 100 μm. Representative western blot of p‐FAK‐Y397, total FAK, and cyclin D1 levels in ARK‐1 cells treated with 5 μm of defactinib for 0, 6, 18, and 24 h. (n = 3 independent experiments). β‐actin expression is used as a loading control. (C) Quantification of glandular perimeter (μm) in ARK‐1 3D cells treated with 10 μm PF‐573228 or 5 μm defactinib for 48 h. Percentage of positive BrdU ARK‐1 cells in a 3D sphere experiment where cells were treated with 0.6 nm, 500 nm, 1 μm, and 5 μm of defactinib for 48 h. Values are means±SD (n = 3 independent experiments); One‐way ANOVA test was used followed by Tukey post hoc test (***P < 0.001). (D) Quantitative analysis of velocity plot (μm·min−1) and accumulated distance (μm) of ARK‐1 cells, treated with either 10 μm PF‐573228 or 5 μm Defactinib. Values are means ± SD (n = 3 independent experiments); One‐way ANOVA test was used followed by Tukey post hoc test (***P < 0.001). (E) Western blot of p‐FAK‐Y397, total FAK and cyclin D1 levels in ARK‐1 scramble and ARK‐1 FAK shRNA cells (n = 3 independent experiments). β‐actin expression is used as a loading control. (F) Representative images and quantification of glandular perimeter (μm) in scramble and FAK shRNA ARK1‐3D spheroids (n = 3 independent experiments); Student's t‐test (***P < 0.001). Scale bar: 100 μm. (G) Quantitative analysis of velocity plot (μm·min−1) and accumulated distance (μm) of ARK‐1 scramble vs. FAK shRNA cells. Values are means±SD (n = 3 independent experiments); Student's t‐test (***P < 0.001).
