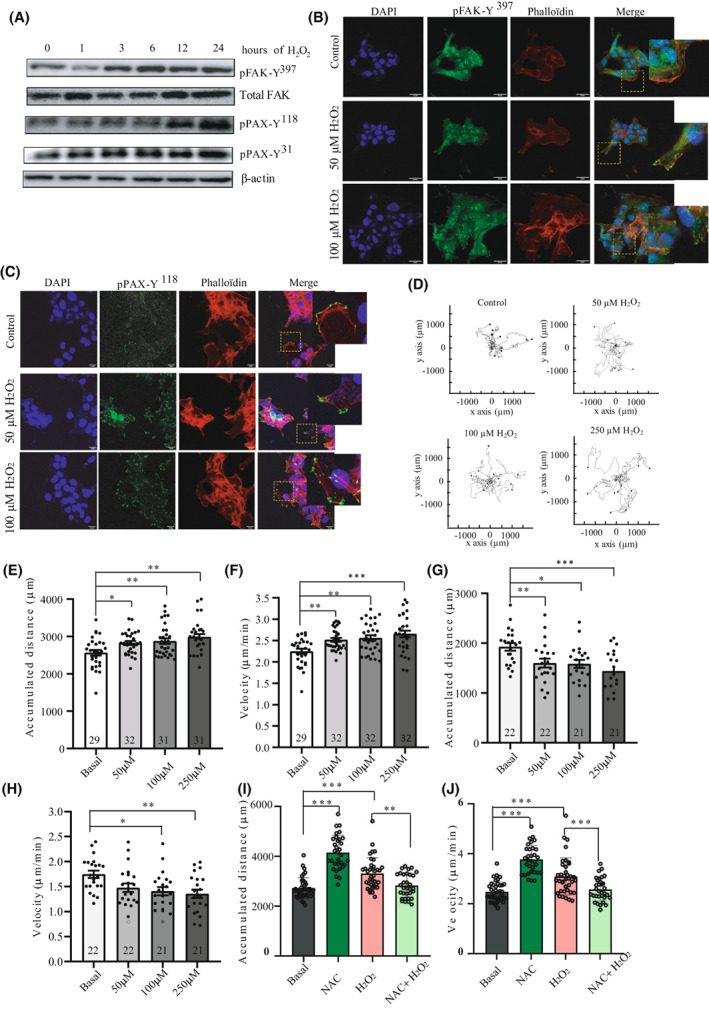
Fig. 5.

FAK activation under oxidative stress enhances USC single‐cell migration and directionality. (A) Representative western blot of ARK‐1 cells stimulated with 0.5 mm of H2O2 at the indicated times (n = 3 independent experiments). Cell lysates were immunoblotted with antibodies against p‐FAK‐Y397, total FAK, p‐PAX‐Y31, p‐PAX‐Y118. Β‐actin was used as a loading control. (B) Representative images of immunofluorescence staining of p‐FAK‐Y397 in control and H2O2‐stimulated (50 and 100 μm) ARK‐1 cells, assessed by confocal microscopy (n = 3 independent experiments). DAPI (blue), p‐FAK‐Y397 (green), and phalloidin (red). Scale bar: 20 μm. (C) Representative images of immunofluorescence staining of p‐PAX (Y118) in control and H2O2‐stimulated (50 and 100 μm) ARK‐1 cells, assessed by confocal microscopy DAPI (blue), p‐PAX‐Y118 (green), and phalloidin (red) (n = 3 independent experiments). Scale bar: 20 μm. (D) Trajectory plots showing control and H2O2‐stimulated (50, 100, and 250 μm) ARK‐1 cells trajectory for 20 h (n = 3 independent experiments). All tracks were set to a common origin (intersection of x and y axes) using Chemotaxis plugin of ImageJ/Fiji. (E) Quantitative analysis of accumulated distance (μm) and (F) velocity (μm·h−1) of single ARK‐1 control cells and cells treated with 50, 100, and 250 μm H2O2. Values are mean ± SD (n = 3 independent experiments); One‐way ANOVA was used followed by Tukey post hoc test (*P < 0.05; **P < 0.01; ***P < 0.001). (G) Quantitative analysis of accumulated distance (μm) and (H) velocity (μm·h−1) of single ARK‐1 control cells and cells treated with 50, 100, and 250 μm H2O2 and 5 μm Defactinib. Values are mean ± SD (n = 3 independent experiments); One‐way ANOVA was used followed by Tukey post hoc test (*P < 0.05; **P < 0.01; ***P < 0.001). (I) Quantitative analysis of accumulated distance (μm) and (J) velocity (μm·h−1) of single ARK‐1 control cells and cells treated with 1 mm NAC, 250 μm H2O2, and 1 mm NAC + 250 μm H2O2. Values are mean ± SD (n = 3 independent experiments); One‐way ANOVA was used followed by Tukey post hoc test (**P < 0.01; ***P < 0.001).
