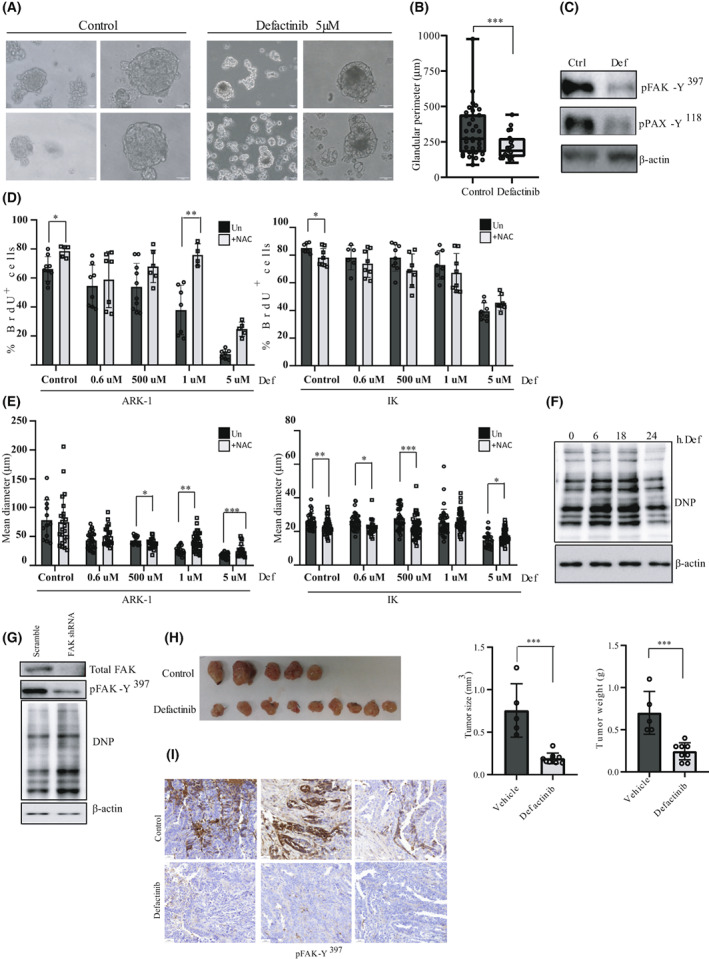
Fig. 6.

FAK inhibition reduces CTOS model cell viability and in vivo PDOX tumor growth of USC. (A) Representative phase contrast images of CTOS in untreated (control) and treated (5 μm Defactinib) cells for 24 h (n = 3 independent experiments). A magnification is shown, Scale bar: 30 μm. (B) Quantitative analysis of CTOS glandular perimeter (μm) in untreated and Defactinib‐treated spheroids. Values are median ± CI (n = 3 independent experiments; Mann–Whitney U‐test; ***P = 0.004). (C) Representative western blot of CTOS in untreated and Defactinib‐treated cells. Cell lysates were immunoblotted with antibodies against p‐FAK‐Y397 and p‐PAX‐Y118 (n = 3 independent experiments). Β‐actin was used as a loading control. (D) Percentage of BrdU‐positive cells in ARK‐1 and IK spheroid cultures. Cells were either left untreated or were pre‐treated with 1 mm NAC before stimulation at the indicated doses of Defactinib, and then allowed to form 3D spheroid cultures for 48 h, after which BrdU was added to the spheroid cultures. Values are mean ± SD (n = 3 independent experiments); Student's t‐test (*P < 0.05; **P < 0.01). (E) Quantification of spheroid mean diameter (μm) in 3D spheroids from ARK‐1 and IK cells. Values are mean ± SD (n = 3 independent experiments); Student's t‐test (*P < 0.05; **P < 0.01; ***P < 0.001). (F) Representative western blot against DNP in ARK‐1 cells stimulated for the indicated times with defactinib 5 μm (n = 3 independent experiments). (G) Representative western blot against p‐FAK‐Y397, total FAK, and DNP in scramble and lentiviral transduced FAK shRNA cells. β‐actin was used as a loading control (n = 3 independent experiments). (H) Images of PDOX tumors at mice sacrifice in untreated (control) and treated (100 mg·kg−1 Defactinib) conditions. Quantitative analysis of tumor size (mm3) and weight (g) in vehicle and Defactinib‐treated tumors. Values are mean ± SD; Student's t‐test (***P = 0.0002 and P = 0.0004, respectively). (I) Representative pictures of p‐FAK‐Y397 immunostaining in control and defactinib PDOX tumors. Scale bar: 50 μm.
