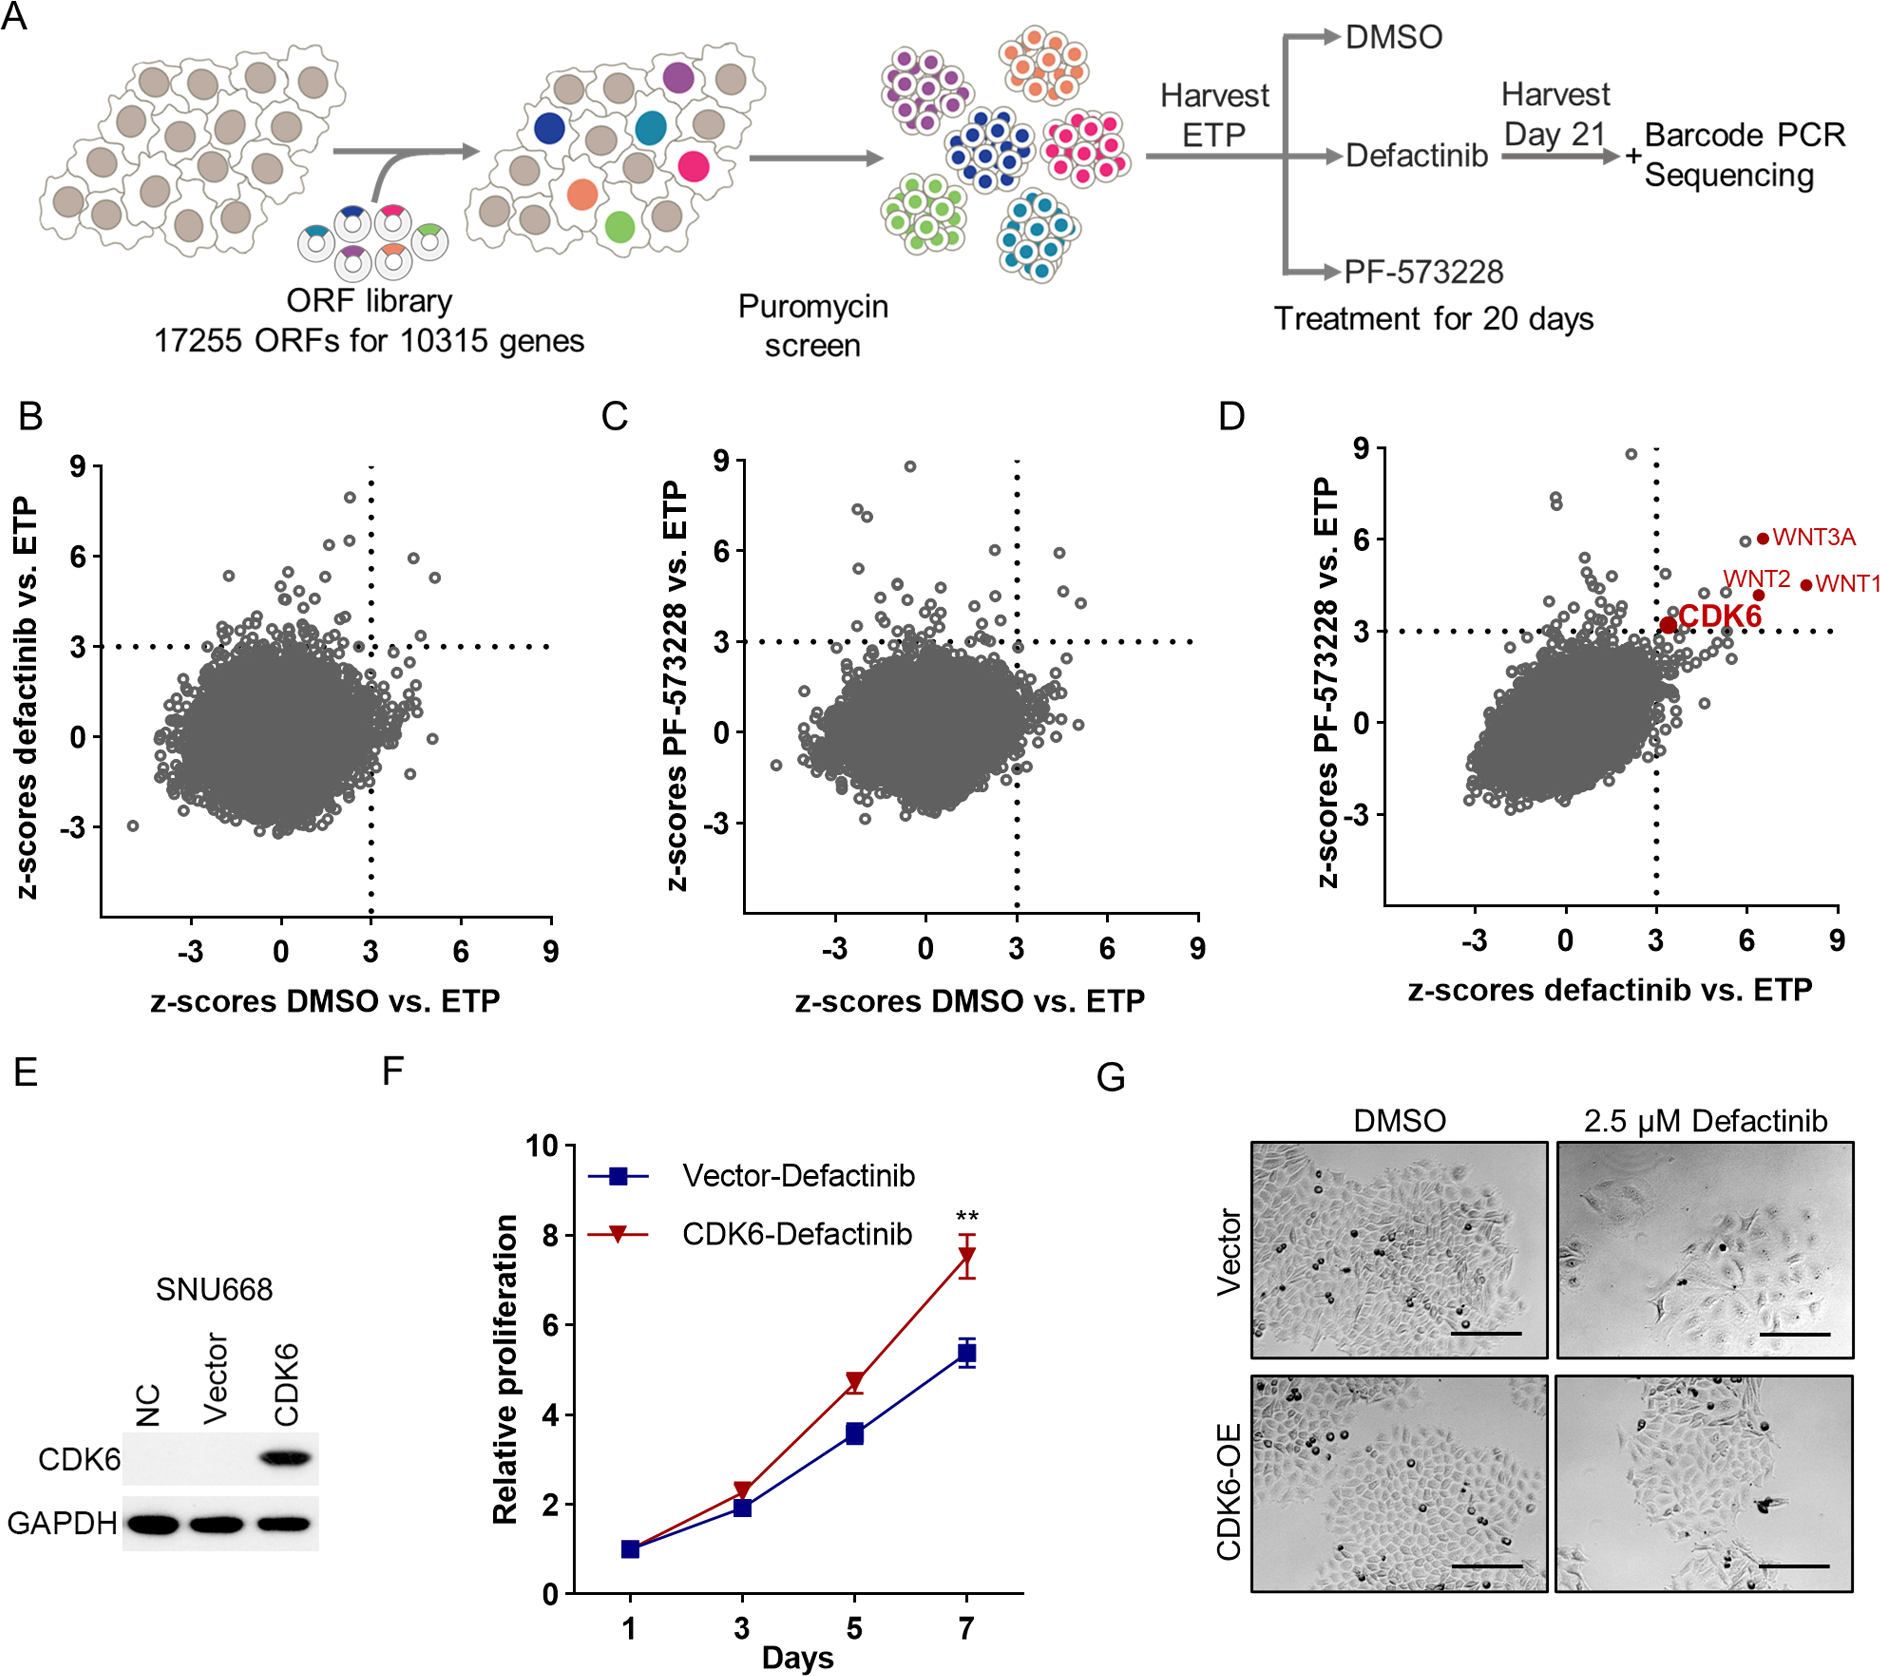
Figure 1. Genome-scale lentiviral ORFeome library screen identifies drivers of FAK inhibitor resistance in DGC.

(A) Schematic description of the genome-scale ORFeome library screen. (B, C) Scatter plots presenting the z-scores of average log2(fold change) for defactinib vs. ETP (y-axis) and for DMSO vs. ETP (x-axis) (B); PF-573228 vs. ETP (y-axis) and DMSO vs. ETP (x-axis) (C) in Cdh1−/−RHOAY42C/+ organoids. Z-scores of DMSO vs. ETP < 3 nominate genes not associated with enhanced growth in the DMSO, whereas z-scores of defactinib or PF-573228 vs. ETP ≥ 3 nominate genes associated with resistance to defactinib or PF-573228. Genes with z-scores < 3 for DMSO and ≥ 3 for defactinib or PF-573228 were nominated as candidate genes conferring resistance and classified as significant ORFs. (D) Scatter plots presenting the z-scores of log2(fold change) for defactinib vs. ETP (x-axis) and for PF-573228 vs. ETP (y-axis) in Cdh1−/−RHOAY42C/+ organoids. (E) Immunoblot analysis to validate CDK6 overexpression in SNU668. (F) In vitro proliferation of control or CDK6 overexpressed SNU668 treated with 2.5 μM defactinib for indicated days. The results are the representative of three independent experiments, each done in quadruplicate. Data are mean ± S.D. **P<0.01, two-way ANOVA test. (G) Representative images of control or CDK6 overexpressed SNU668 treated with DMSO or 2.5 μM defactinib. Scale bar, 100 μm.
