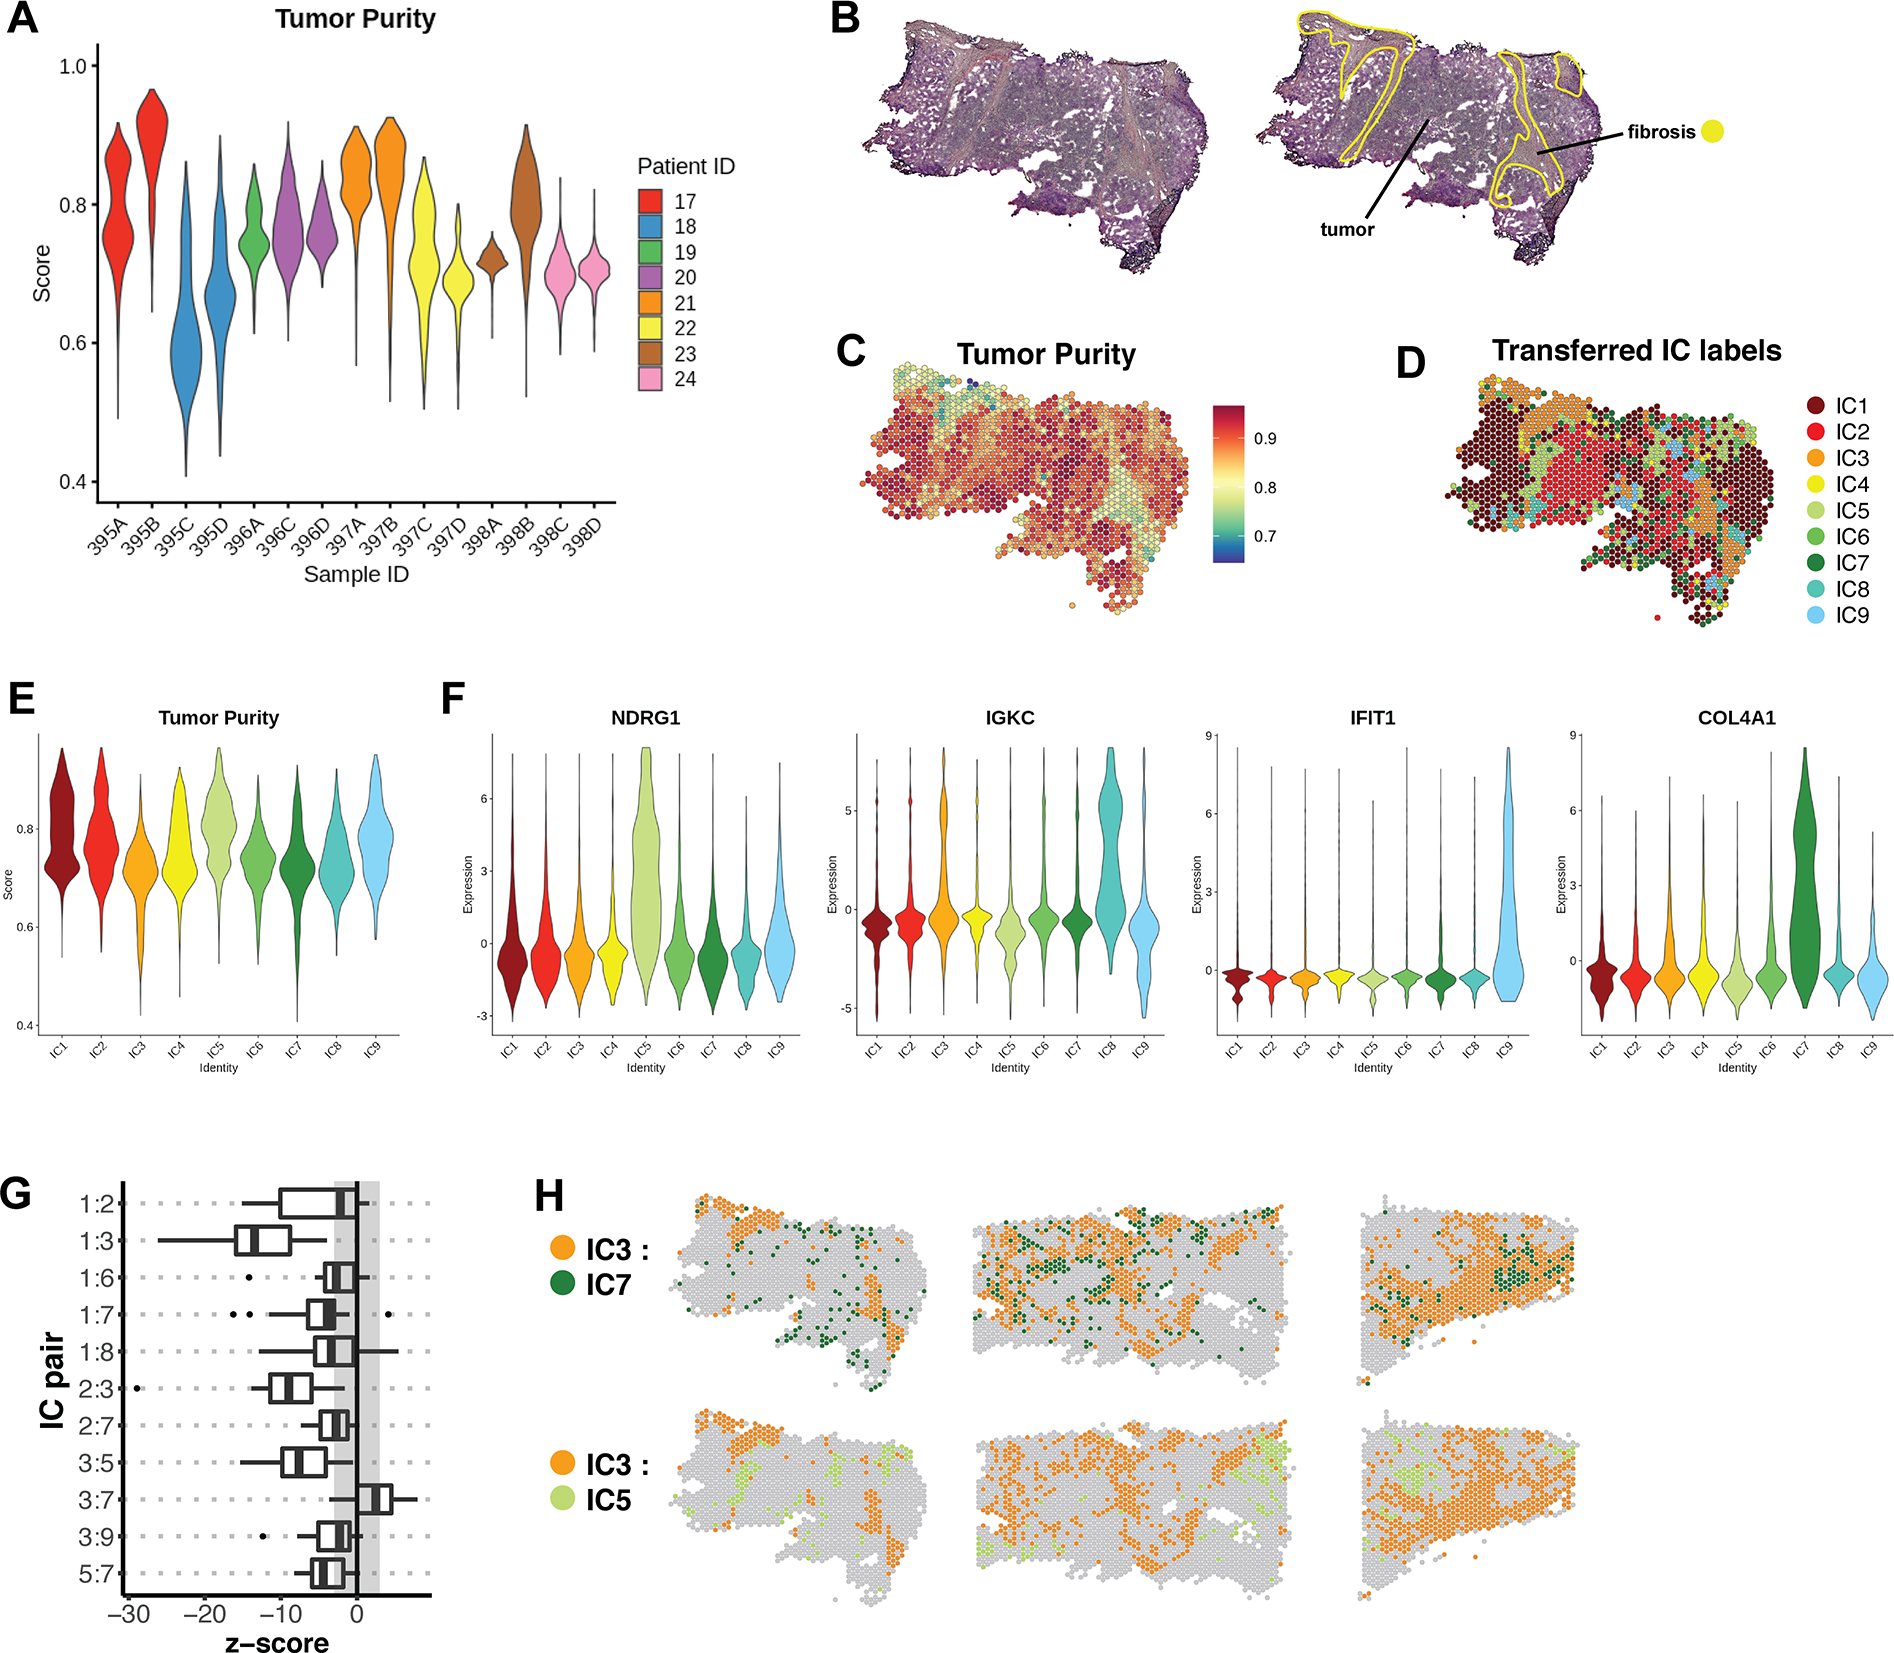
Figure 6. Annotation of a validation cohort with IC labels.

(A) Tumor purity profiles of 15 samples belonging to the validation cohort. (B) Representative sample 395B from the validation cohort, with pathologist’s manual annotation. (C) Per-feature Tumor Purity scores for sample 395B. (D) IC assignments for sample 395B, which were transferred from the integrated dataset by reference mapping. (E) Cumulative Tumor Purity scores for all samples in the validation cohort after each was individually queried for reference mapping. The x-axis represents transferred IC labels. (F) The expression of selected marker genes in the labeled validation cohort. Expression is represented by Pearson residuals. (G) Join count analysis was performed on labeled samples of the validation cohort. The box plot represents a summary of the resulting z-scores for a subset of cluster pairs that were found to be significant in the reference cohort. (H) Spatial validation of cluster pairs with positive and negative spatial dependencies in representative samples of the validation cohort.
