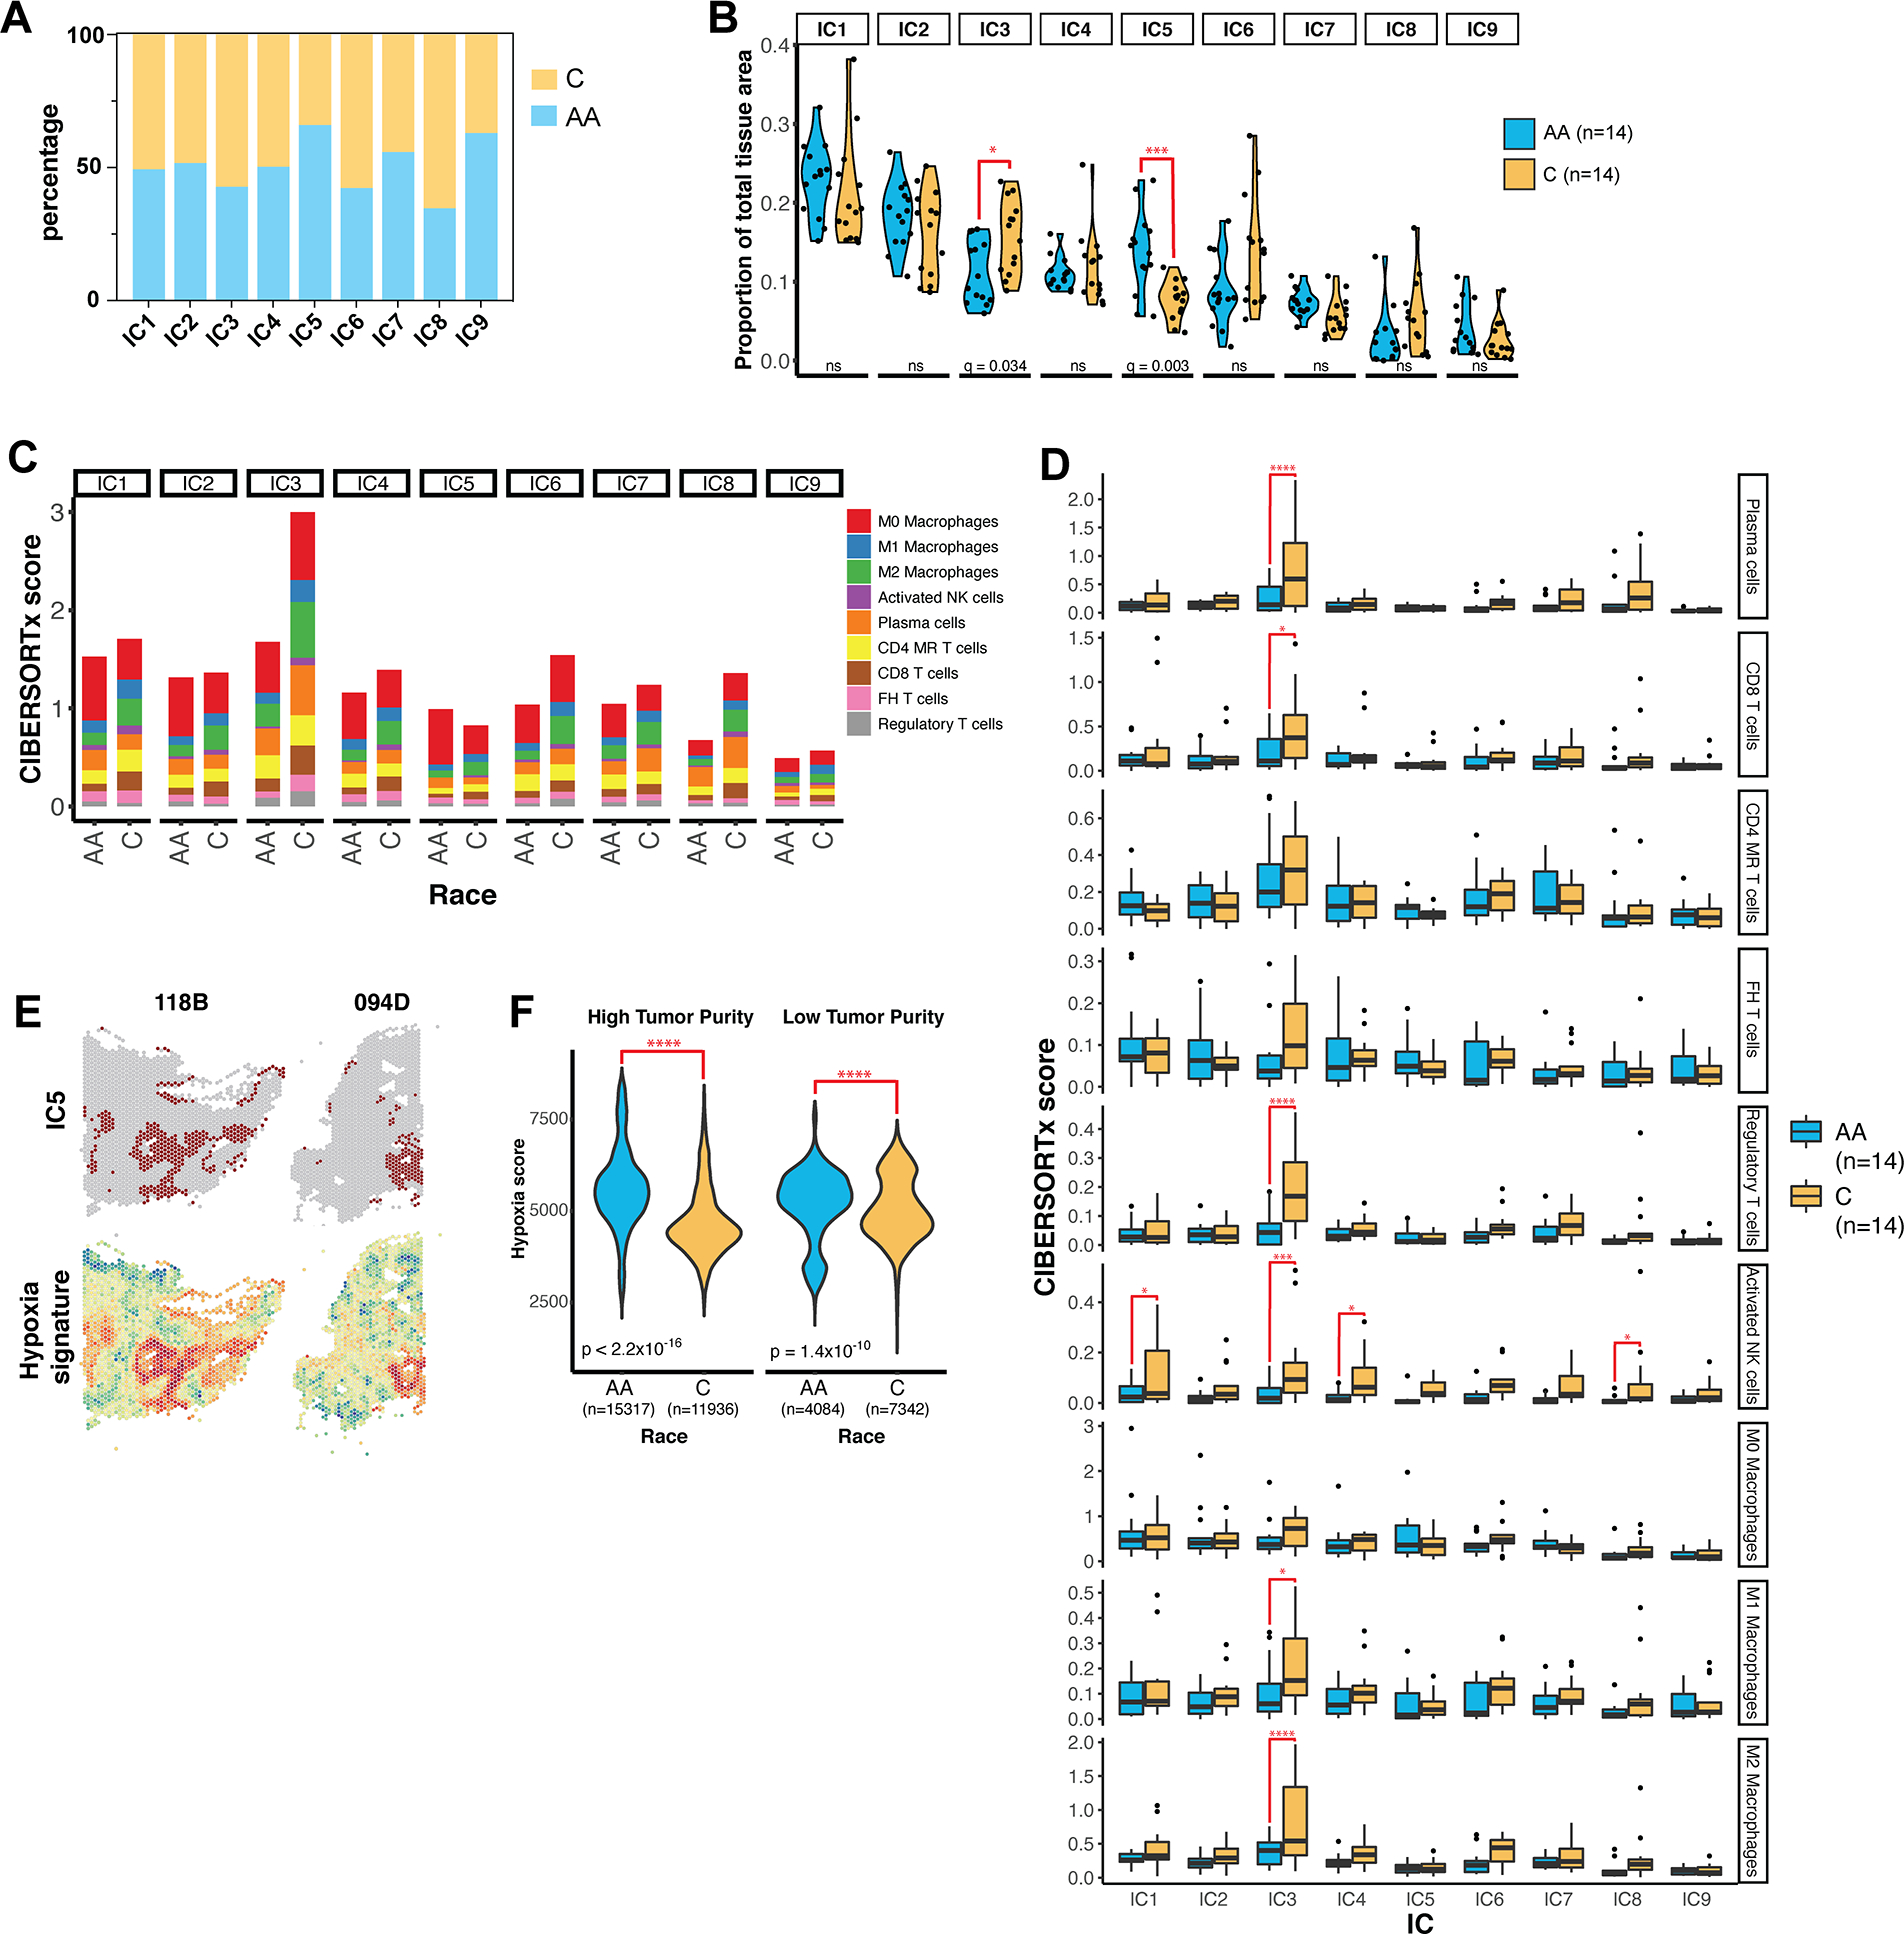
Figure 7. Annotation of ICs in the context of racial disparities.

(A) The percentage of features in each IC contributed by Caucasian (C) and African American (AA) samples in the cohort. (B) The proportion of each IC by total tissue area in each sample was calculated as the number of spatial features belonging to the IC divided by the total number of features in the tissue. IC proportions were compared between AA and C samples using multiple t-test corrected by false discovery rate (FDR). (C) Immune content of ICs in AA and Caucasian samples as determined by CIBERSORTx. Absolute CIBERSORTx scores are represented on the y-axis. MR = memory resting, FH = follicular helper. (D) Boxplots summarizing the immune content determined by IC in individual samples. q-values were determined by multiple t-testing corrected by FDR. * = q < 0.05; *** = q < 0.001; **** = q < 0.0001. (E) Spatial maps of features assigned to IC5 and hypoxia signature scores in representative samples. (F) Violin plots of hypoxia enrichment score by race in features with high tumor purity (score > 0.75) and low tumor purity (score < 0.75). n indicates the number of spatial features in each group. P-value was determined by Welch’s two-sample t-test.
