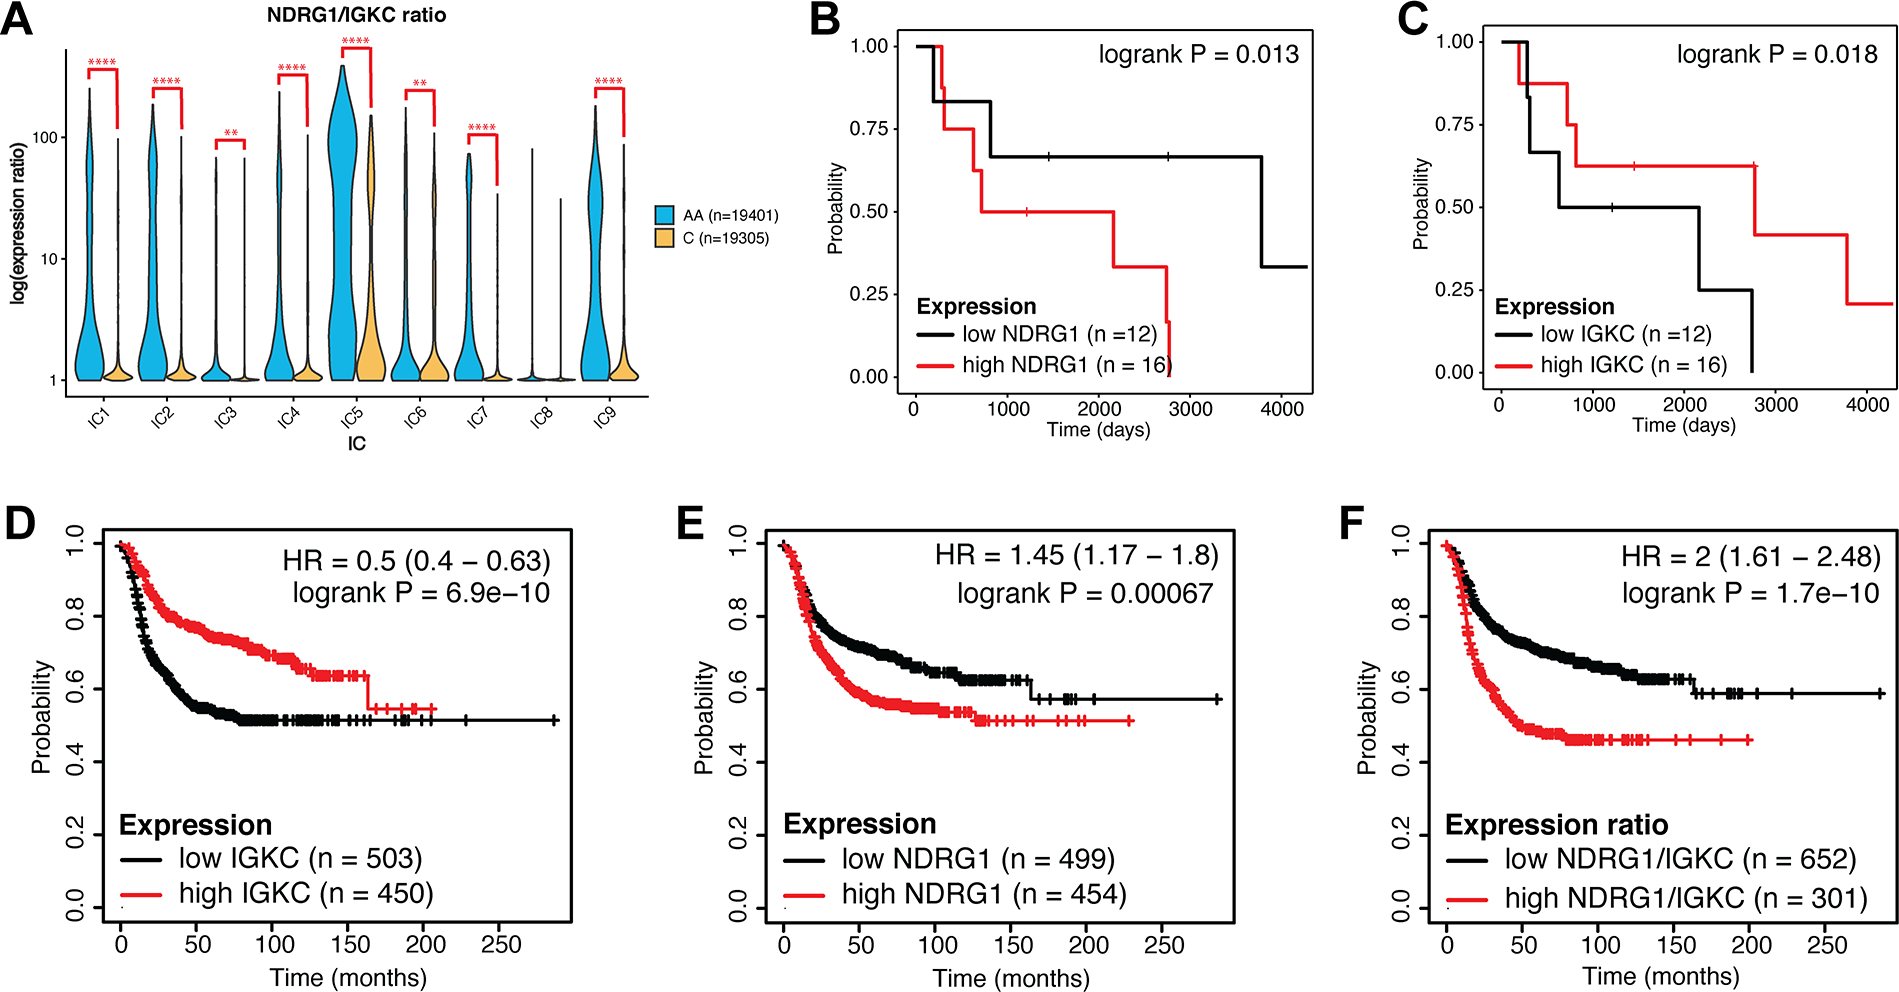
Figure 8. NDRG1 and IGKC expression correlate with survival in TNBC and basal breast cancer.

(A) Violin plot of the ratio of expression of NDRG1 to IGKC by race in each IC. Log-transformed expression ratio is represented on the y-axis. q-value was determined by multiple t-test corrected by false discovery rate. ** = q < 0.01; **** = q < 0.0001. (B-C) Kaplan-Meier plots of relapse-free survival in our reference cohort, when samples were stratified by NDRG1 (B) or IGKC (C) expression as detailed in Methods. (D-F) Kaplan-Meier plots of relapse-free survival stratified by IGKC expression (D), NDRG1 expression (E), and NDRG1/IGKC ratio (F) in molecularly subtyped basal breast cancer. Analysis is based on publicly available microarray expression datasets as detailed in Methods. Hazard ratio (HR) and p-value are indicated.
