. 2022 Oct 3;22(1):102–111. doi: 10.1158/1535-7163.MCT-22-0375

Figure 6.

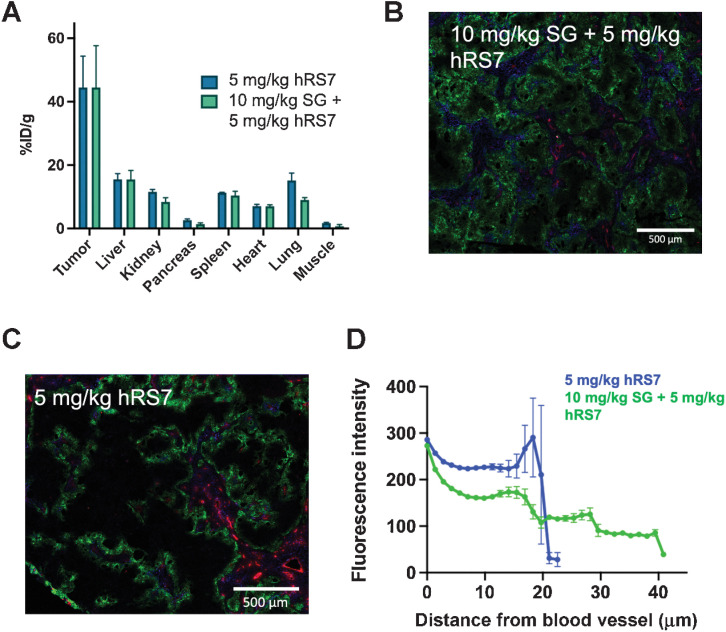
Figure 6. Impact of Dosing Schedule. SG is dosed on D1 and D8 of a 21-day cycle. To examine the impact on distribution and uptake, 10 mg/kg SG was administered to mice bearing NCI-N87 xenografts, followed 7 days later by 5 mg/kg of fluorescent hRS7. The total tumor uptake (fluorescent %ID/g) was similar following SG treatment (mean and SD, n = 3; A). However, the distribution within the tumor was greater following SG treatment (B) than fluorescent hRS7 alone (C). CD31, red; intravenous Hoechst, blue; hRS7-AF680, green. Image quantification showing the mean and SEM using a Euclidean distance map confirmed deeper tissue penetration (D), which could be due to antibody from the SG treatment contributing to increased tissue penetration.

Impact of Dosing Schedule. SG is dosed on D1 and D8 of a 21-day cycle. To examine the impact on distribution and uptake, 10 mg/kg SG was administered to mice bearing NCI-N87 xenografts, followed 7 days later by 5 mg/kg of fluorescent hRS7. The total tumor uptake (fluorescent %ID/g) was similar following SG treatment (mean and SD, n = 3; A). However, the distribution within the tumor was greater following SG treatment (B) than fluorescent hRS7 alone (C). CD31, red; intravenous Hoechst, blue; hRS7-AF680, green. Image quantification showing the mean and SEM using a Euclidean distance map confirmed deeper tissue penetration (D), which could be due to antibody from the SG treatment contributing to increased tissue penetration.