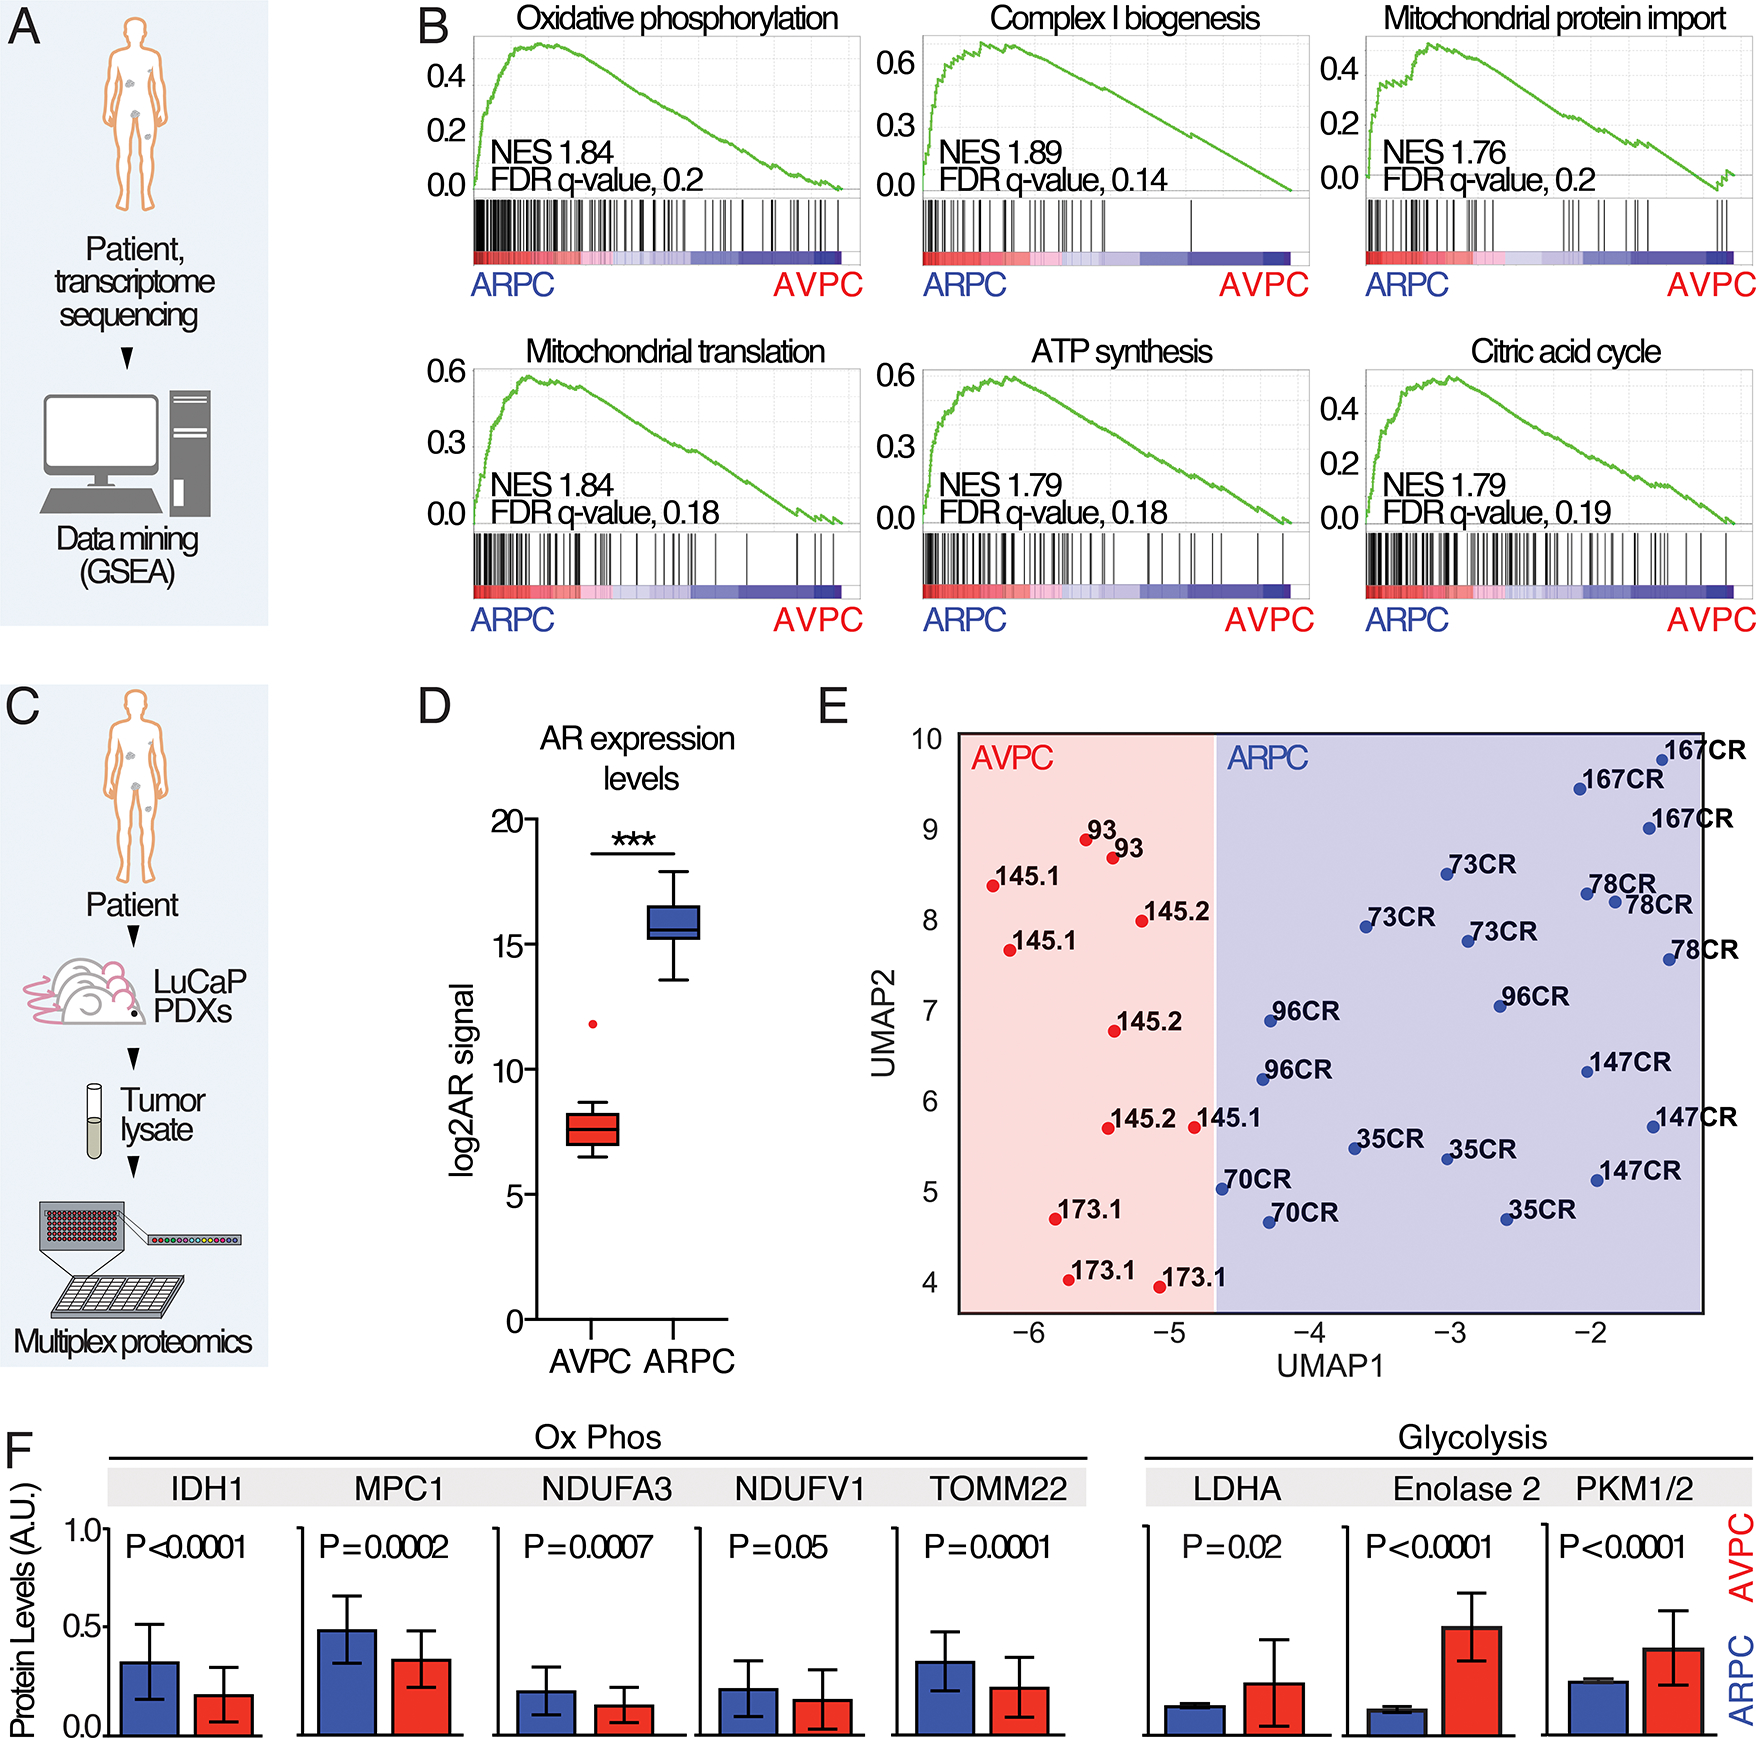
Fig. 1. Transcriptomic and proteomic analysis of ARPC and AVPC samples.

A) Schematic representation of the experiment: data from (16) were segregated in ARPC and AVPC based on AR and NE scores and GSEA analysis performed. B) GSEA enrichment plots; Normalized enrichment scores (NES) and false discovery rate (FDR)-q values are shown. C) Schematic representation of the RPPA study using PDX samples. D) Androgen expression levels in ARPC and AVPC. P value was estimated through Mann Whitney test, (***) P < 0.001. E) A UMAP shows clustering within ARPC and AVPC LuCaP PDX models. CR, Castration-resistant. F) Representative plots showing 8 different proteomic measurements in APRC and AVPC tumor lysate samples. P values are reported.
