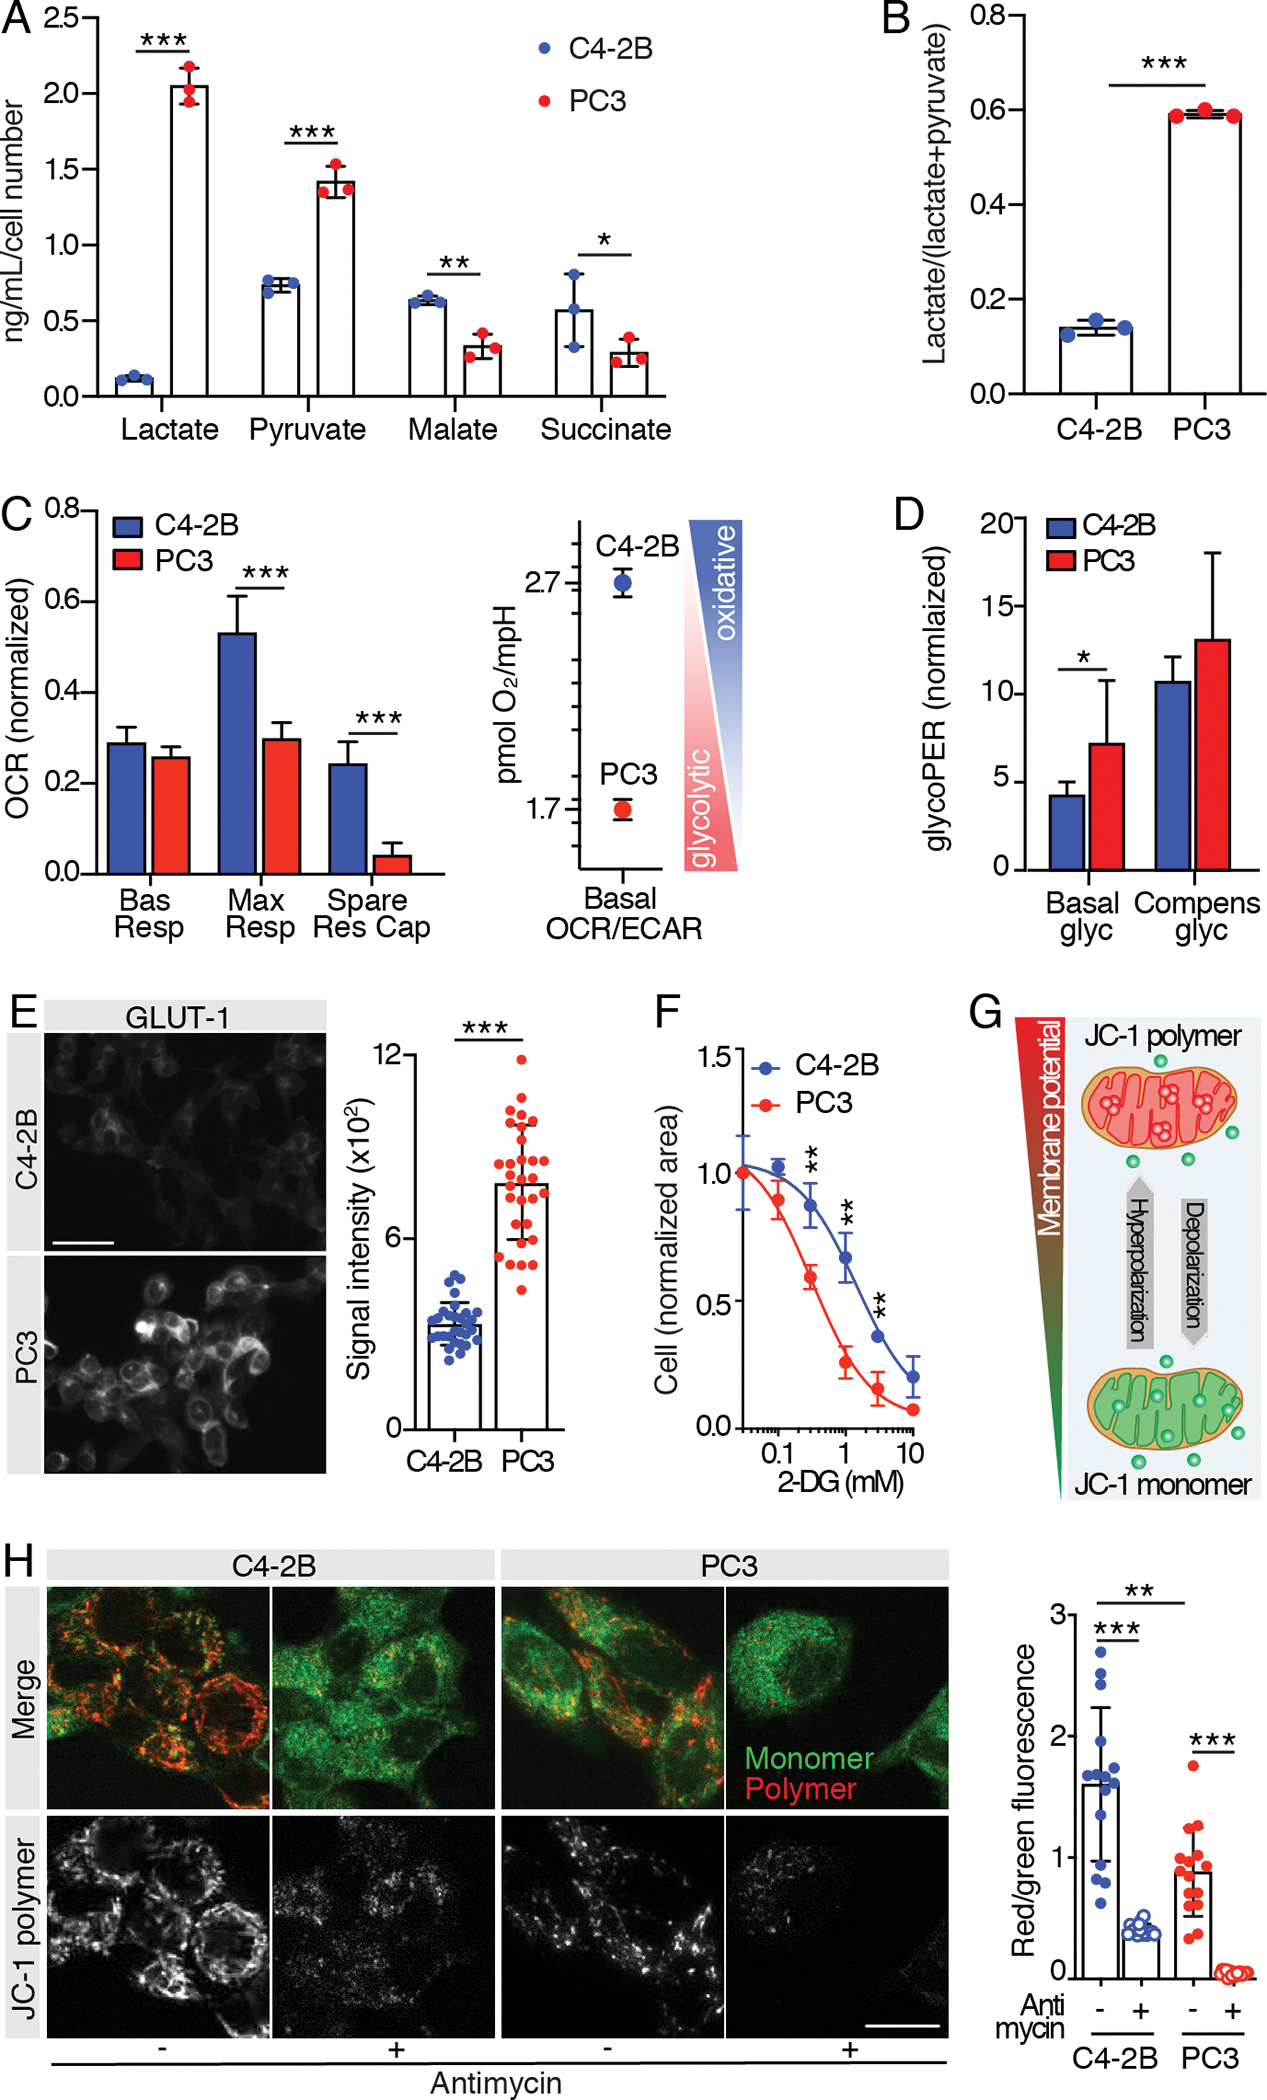
Fig. 2. Metabolic characterization of PCa cell lines.

A) Mass spectrometry analysis of glucose-derived metabolites (lactate, pyruvate, malate and succinate) and B) glycolytic index “lactate/(lactate + pyruvate)” in C4–2B and PC3 24 hours-conditioned extracellular medium; n=3 wells/group, metabolite concentration values were normalized over cell-free culture medium metabolite-content and total cell number. C, D) Mitochondrial function parameters from Seahorse Mito Stress test (C) and Seahorse Glycolytic Rate assay (D) on C4–2B and PC3 cells; the experiments were performed 2 times, 1 representative experiment is shown, n=8 wells/group. Oxygen Consumption Rate (OCR) and glycolytic Proton Efflux Rate (glycoPER) values were normalized on the live cell area/well. E) Representative images of C4–2B and PC3 cells immunostained for glucose transporter 1 (GLUT-1) (scale bar: 50 μm); signal quantification is shown from 30 cells (10 cells/independent experiment); statistical significance was calculated on the average of the three experiments. F) Dose-response tumor cell growth curves in the presence of 2-DG; the experiments were performed 2 times, 1 representative experiment is shown, n=3 wells/group. G) Cartoon showing JC-1 probe potential-dependent accumulation and aggregation in functional mitochondria. H) Representative images of C2–2B and PC3 cells stained with JC-1 probe (scale bar: 20 μm); JC-1 polymer/monomer (red/green) fluorescence ratio is shown; n= 15 cells/group.
All the values are presented as mean ± SD; p-values were estimated through unpaired Student’s t test (A-F) or one-way ANOVA, followed by Tukey’s HSD post-hoc test (H): (*) P < 0.05, (**) P < 0.01, (***) P < 0.001, (no *) not significant, as indicated.
