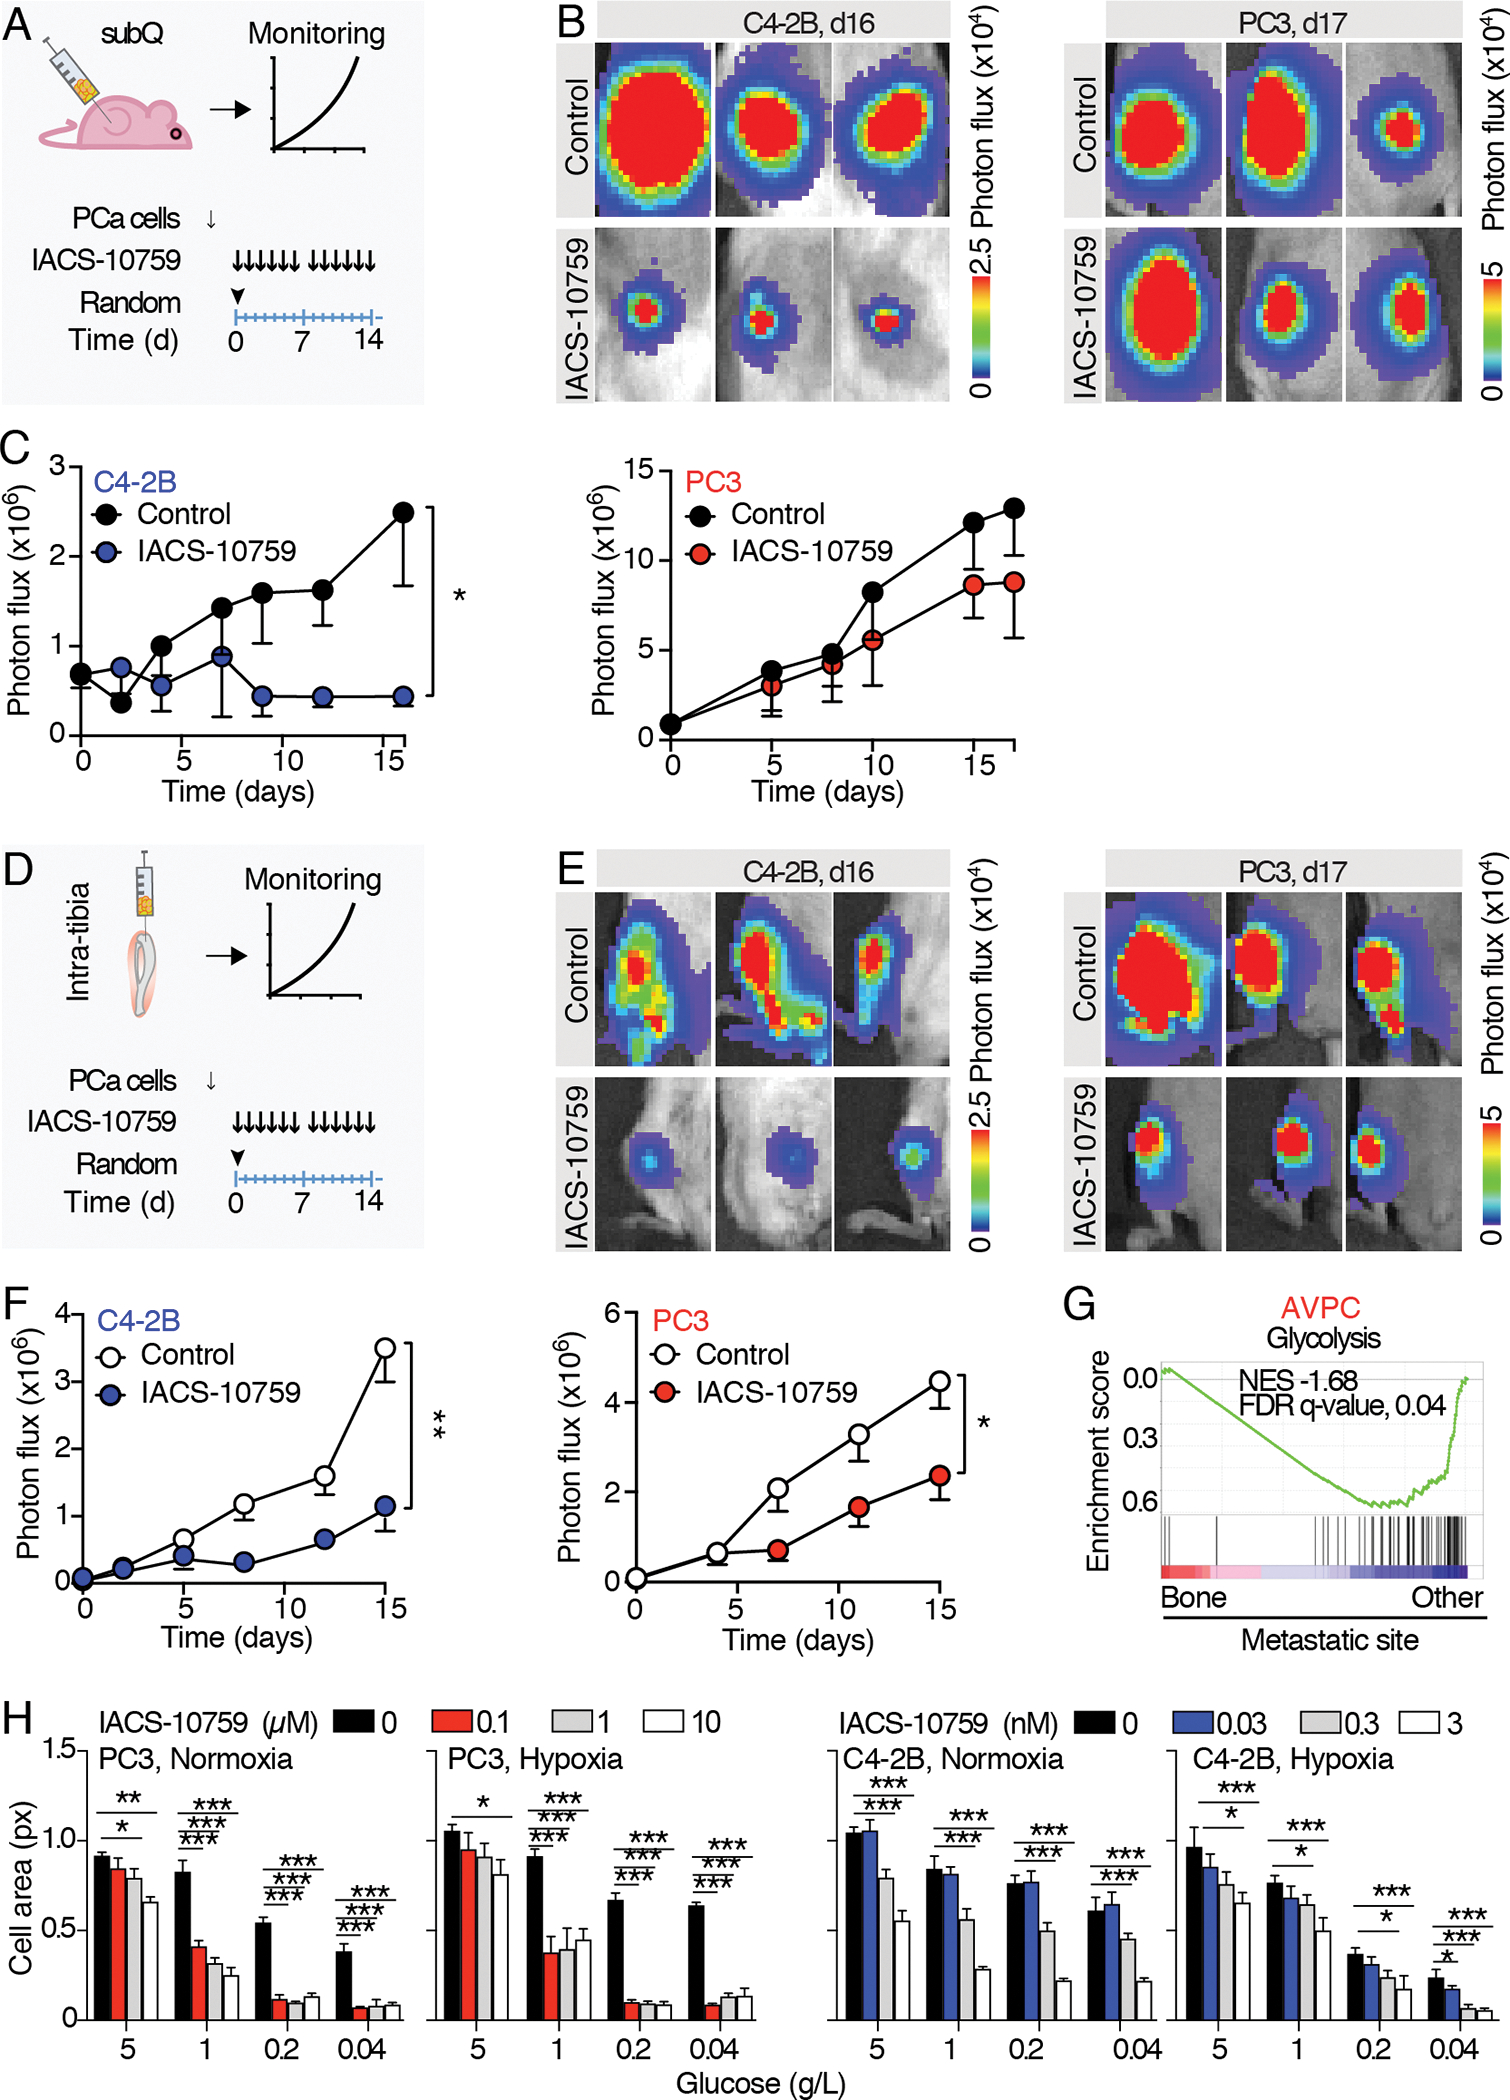
Fig. 4. Macroscopic therapy response of PCa subcutaneous and intratibial tumor to IACS-10759 monitored by bioluminescence detection.

A) Schematic representation of the experimental schedule for subcutaneous tumors. 15 to 30 days after PC3/C4–2B tumor cells injection, mice were randomized and treated with IACS-10759 (10 mg/Kg in 0.5% methyl cellulose by oral gavage following a 5 days/week schedule). B) Representative images of subcutaneous tumor-derived bioluminescence detected by IVIS-200. C) Longitudinal monitoring of subcutaneous tumor growth; n=5 tumors per group. D) Schematic representation of the experimental schedule for intratibial tumors. 5 days after PC3/C4–2B tumor cells injection, mice were randomized and treated with IACS-10759 (10 mg/kg in 0.5% methyl cellulose by oral gavage following a 5 days/week schedule). E) Representative images of intratibial tumor-derived bioluminescence monitored by IVIS-200. F) Longitudinal monitoring of intratibial tumor growth; n=12 tibiae per group. Mean ± SD, p-values were estimated through unpaired Student’s T-test: (*) p < 0.05, (**) p < 0.01, as indicated. subQ = subcutaneous; random = randomization time; d = days. G) GSEA enrichment analysis performed on (24); Normalized enrichment scores (NES) and false discovery rate (FDR)-q values are shown. H) Tumor cell growth monitored by cell area of C4–2B and PC3 cells cultured in 2D in normoxic (18%) or hypoxic (1%) conditions in combination with different glucose concentrations (0.04–5 g/L) and treated with different IACS-10759 concentrations (0–10 μM, PC3; 0–3 nM, C4–2B); the experiments were performed 2 times, 1 representative experiment is shown, n=4 wells/group.
All the values are presented as mean ± SD; p-values were estimated through unpaired Student’s T-test (C, F) or one-way ANOVA, followed by Tukey’s HSD post-hoc test (H): (*) P < 0.05, (**) P < 0.01, (***) P < 0.001, (no *) not significant, as indicated.
