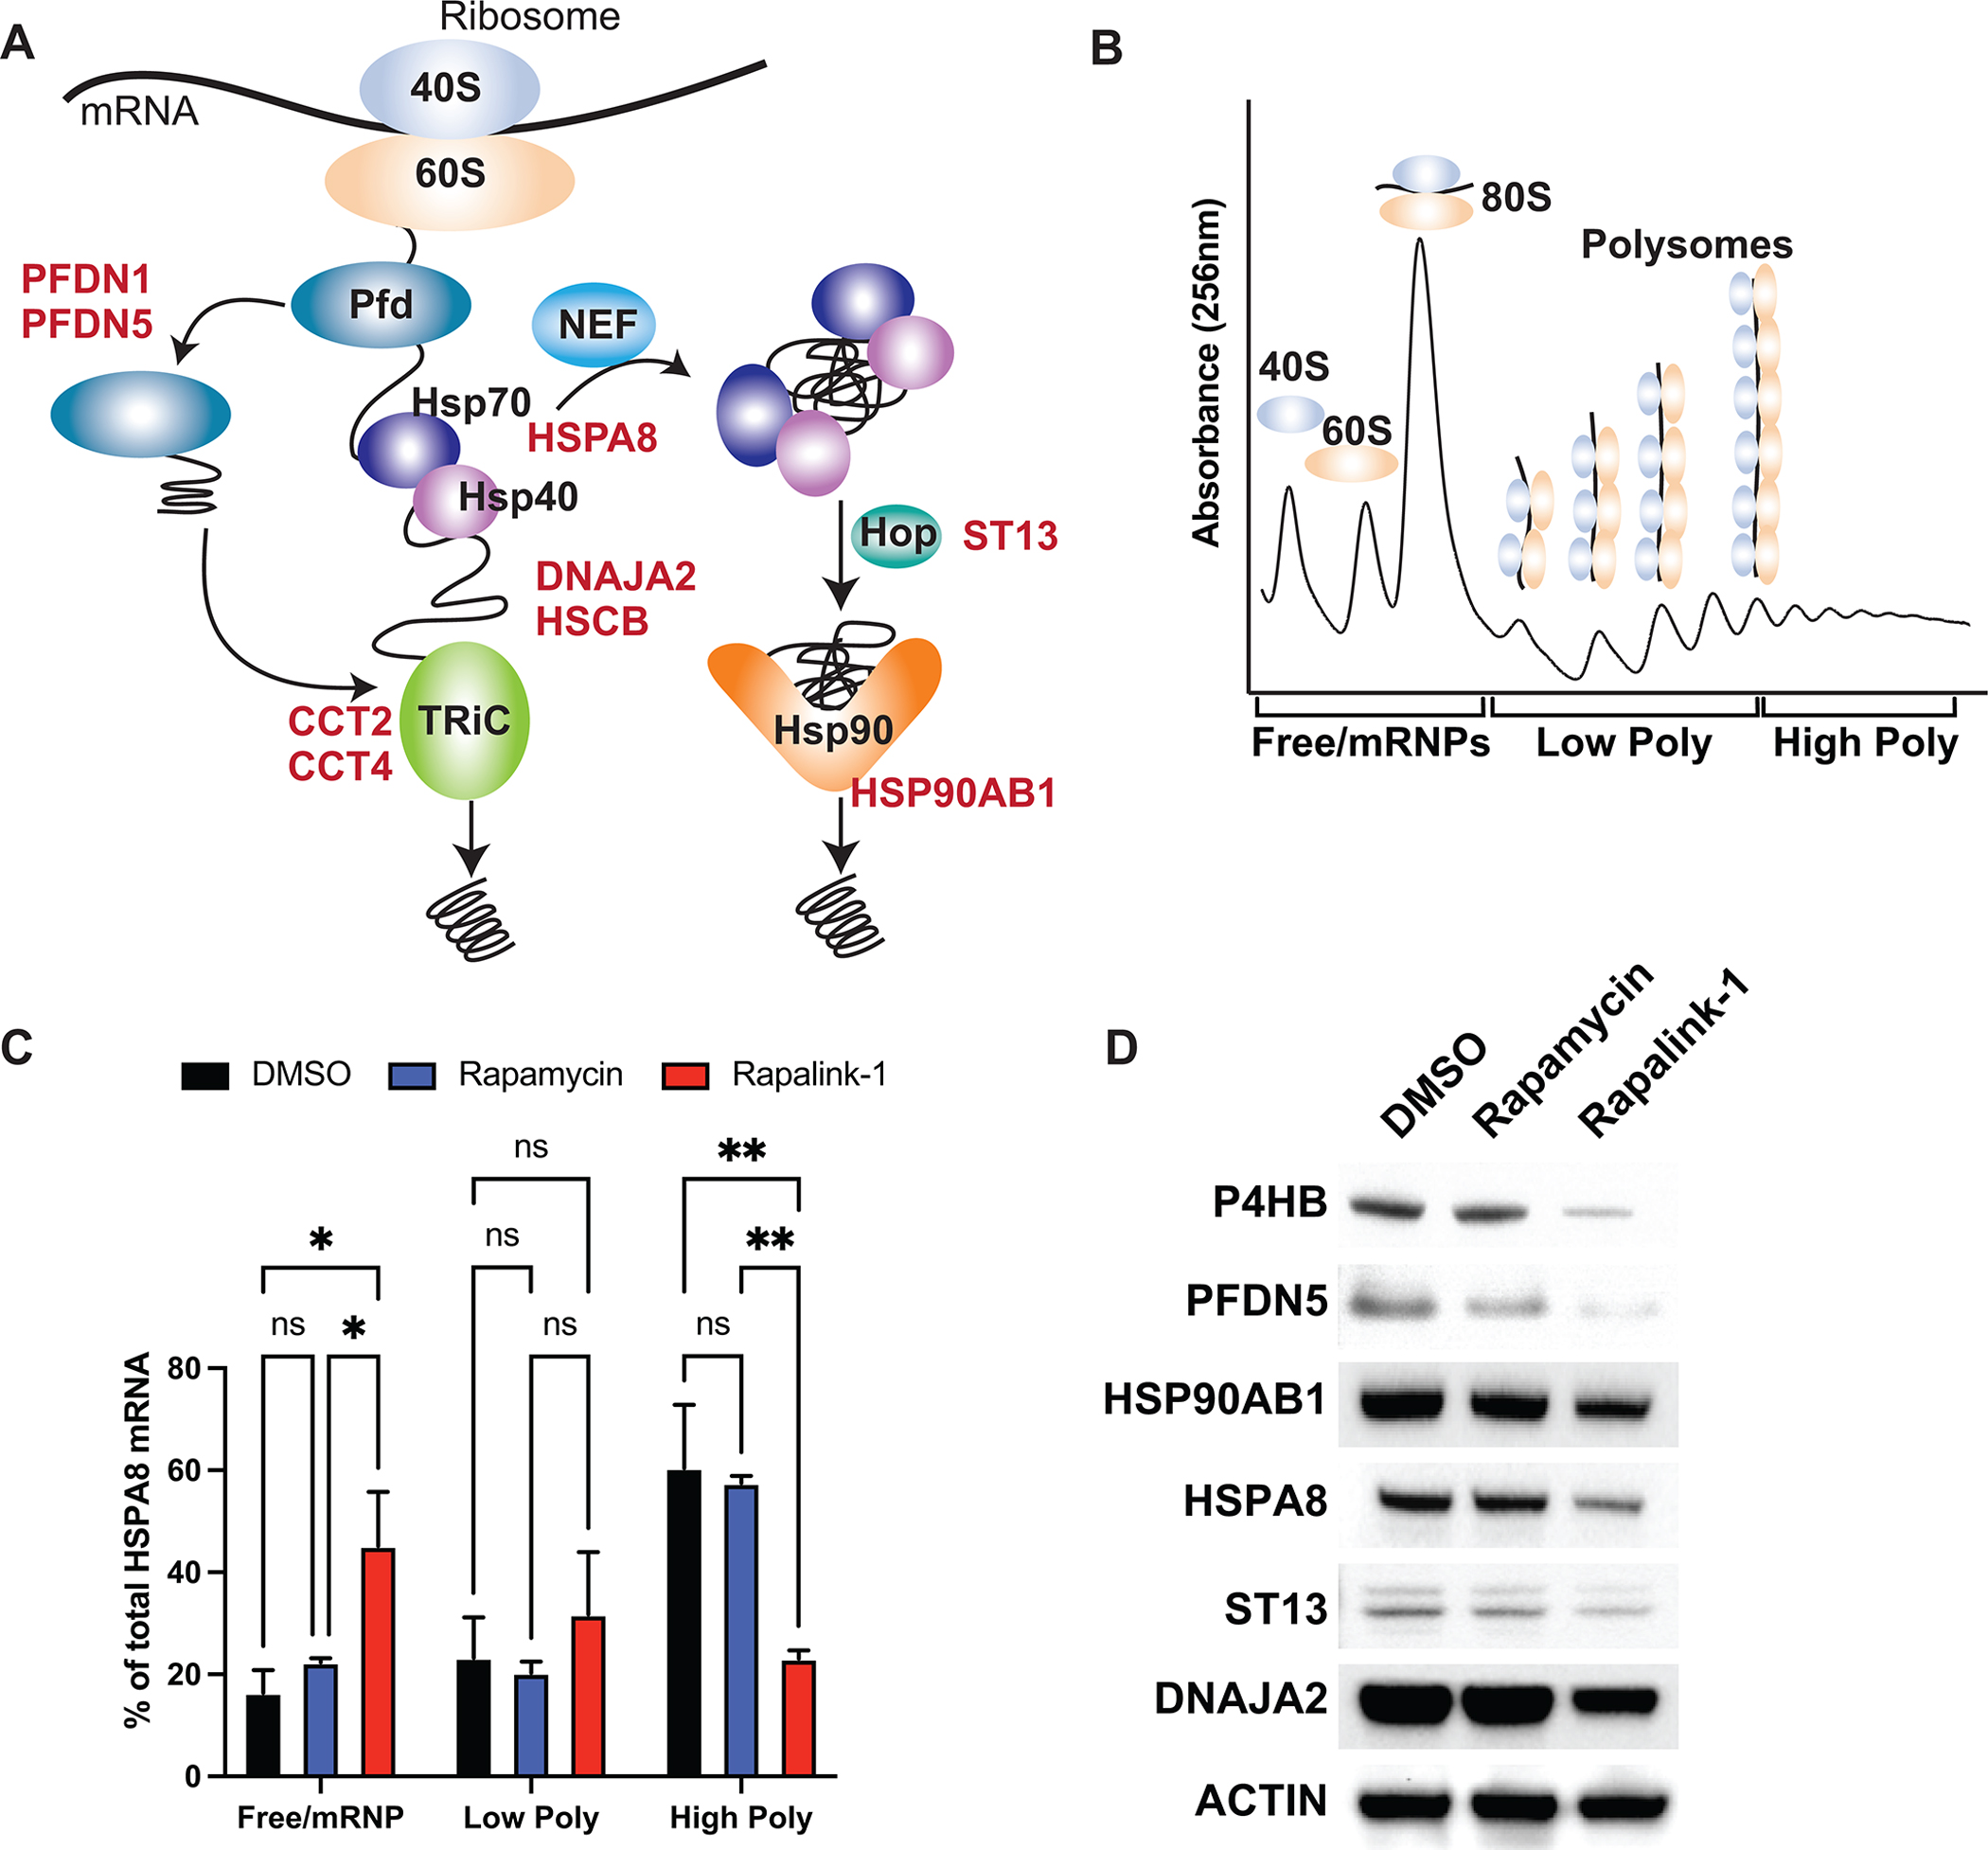
Figure 2. Protein folding machinery is regulated at the translational level by the mTOR pathway.

A, Schematic representation of Hsp70 and Hsp90 machineries. B, Cartoon representation of polysome profiling. C, qPCR analysis of HSPA8 mRNA upon Rapalink-1 and Rapamycin treatment, isolated from 10% - 50% sucrose gradient fractions. Pooled fractions corresponding to free ribosomal subunits and messenger ribonucleoprotein (mRNPs) (Free/mRNPs), low-molecular-weight polysomes (Low Poly), and high-molecular-weight polysomes (High Poly) are displayed. A two-way ANOVA test was performed to determine statistical significance (n = 3). D, Western blot analysis of translationally regulated endogenous proteins upon treatment. All values represent the mean + SEM. *p < 0.05, **p < 0.01
