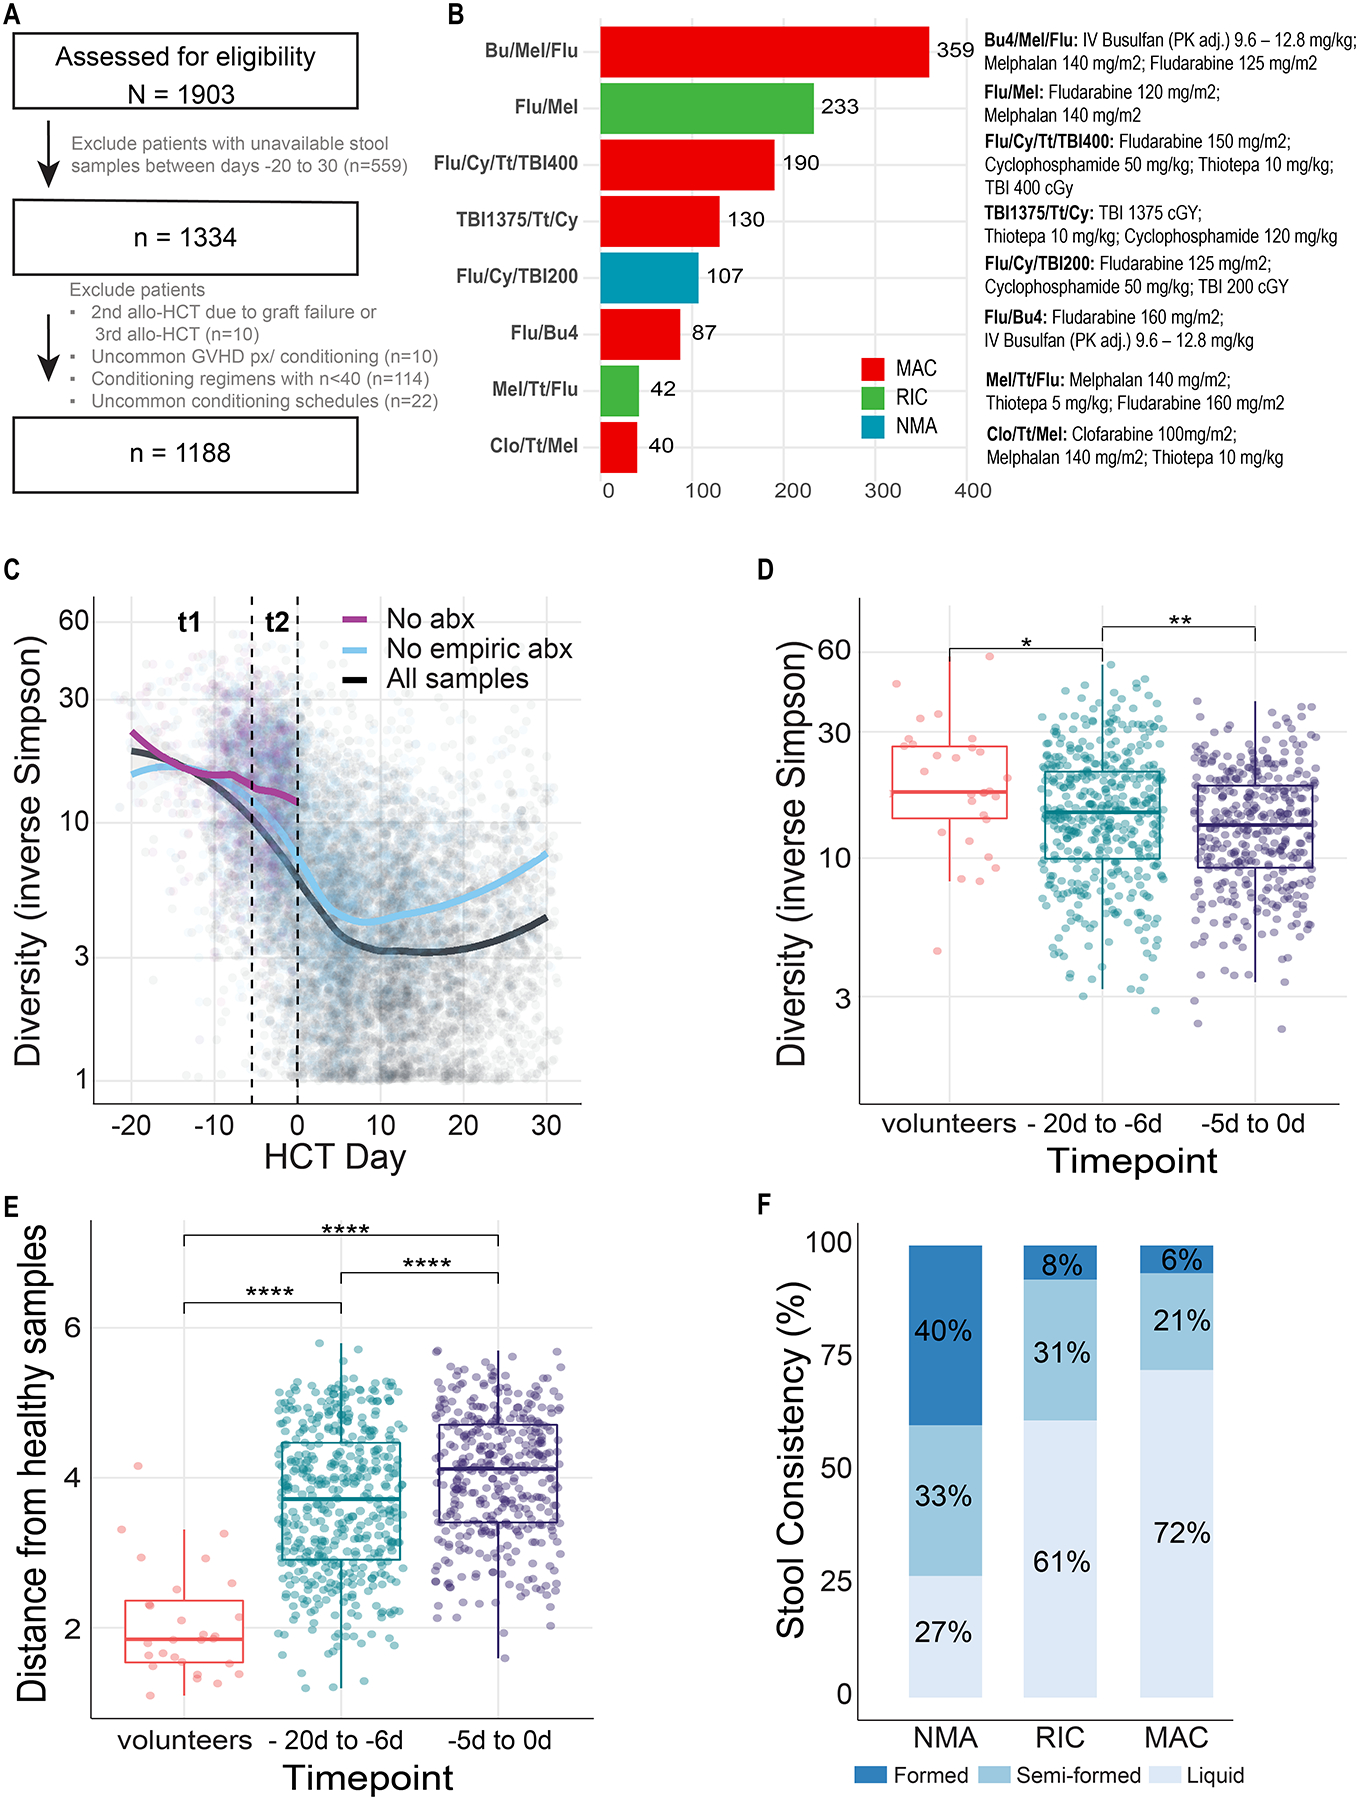
Figure 1. Fecal samples from 1,188 recipients of allo-HCT were analyzed.

(A) CONSORT diagram for patient inclusion. The patients were conditioned with one of the eight regimens received by >40 patients with at least one stool sample collected between days −20 to 30. (B) Flu/Cy/TBI200 was the only nonmyeloablative (NMA) regimen. Flu/Mel and Mel/Tt/Flu were the reduced-intensity conditioning (RIC) regimens; the rest of the regimens were myeloablative (MAC). (C) Not all diversity loss can be attributed to antibiotic exposures. Each point is a stool sample whose α-diversity (as measured by 16S amplicon sequencing and the inverse Simpson index) is plotted over time relative to transplantation. Lines are smoothed average by the LOESS (locally estimated scatterplot smoothing) method, in which each data point (α-diversity measurement) is considered as an independent event. The black curve averages all samples, including those collected before or after any antibiotic exposure. The purple curve ignores any sample collected after exposure to any antibacterial antibiotic; as virtually all patients commenced prophylactic antibiotics by day −2 or with the onset of neutropenia, the purple curve does not extend beyond day 0. The blue curve ignores any samples collected after exposure to non-prophylactic antibiotics, i.e., samples exposed to the prophylactic antibiotics ciprofloxacin and intravenous vancomycin are included in the blue smoothed average. Time bin t1 (day −20 to −6) and t2 (day −5 to 0) are indicated with dashed vertical lines. (D) Among samples from n = 507 patients whose samples were not exposed to any antibacterial antibiotics, α-diversity declines significantly between t1 and t2, indicating that not all diversity loss can be attributed to antibiotic exposures. t1 α-diversity is also significantly lower than those of healthy volunteers (n = 30). Only one stool sample per patient was considered in each time window. (E) Among samples from n = 507 patients whose samples were not exposed to any antibacterial antibiotics, microbiota composition is significantly different between t1 and t2, as measured by Bray-Curtis distance to a centroid of healthy volunteers (n = 28) compositions, indicating that not all composition changes can be attributed to antibiotic exposures. (F) Liquid stool samples (n=957), collected between days 0 to 10, were more commonly collected from recipients of more intense conditioning regimens, as assessed by laboratory technicians at the time of sample aliquoting. X-squared for all samples= 118.44, df = 4, p-value < 2.2 × 10⁻¹⁶.
* p ≤ 0.05, ** p ≤ 0.01, *** p ≤ 0.001, **** p ≤ 0.0001
Abbreviations: allo-HCT – allogeneic hematopoietic cell transplantation; MAC – myeloablative conditioning; RIC – reduced-intensity conditioning; NMA – nonmyeloablative conditioning; Abx – antibiotics.
