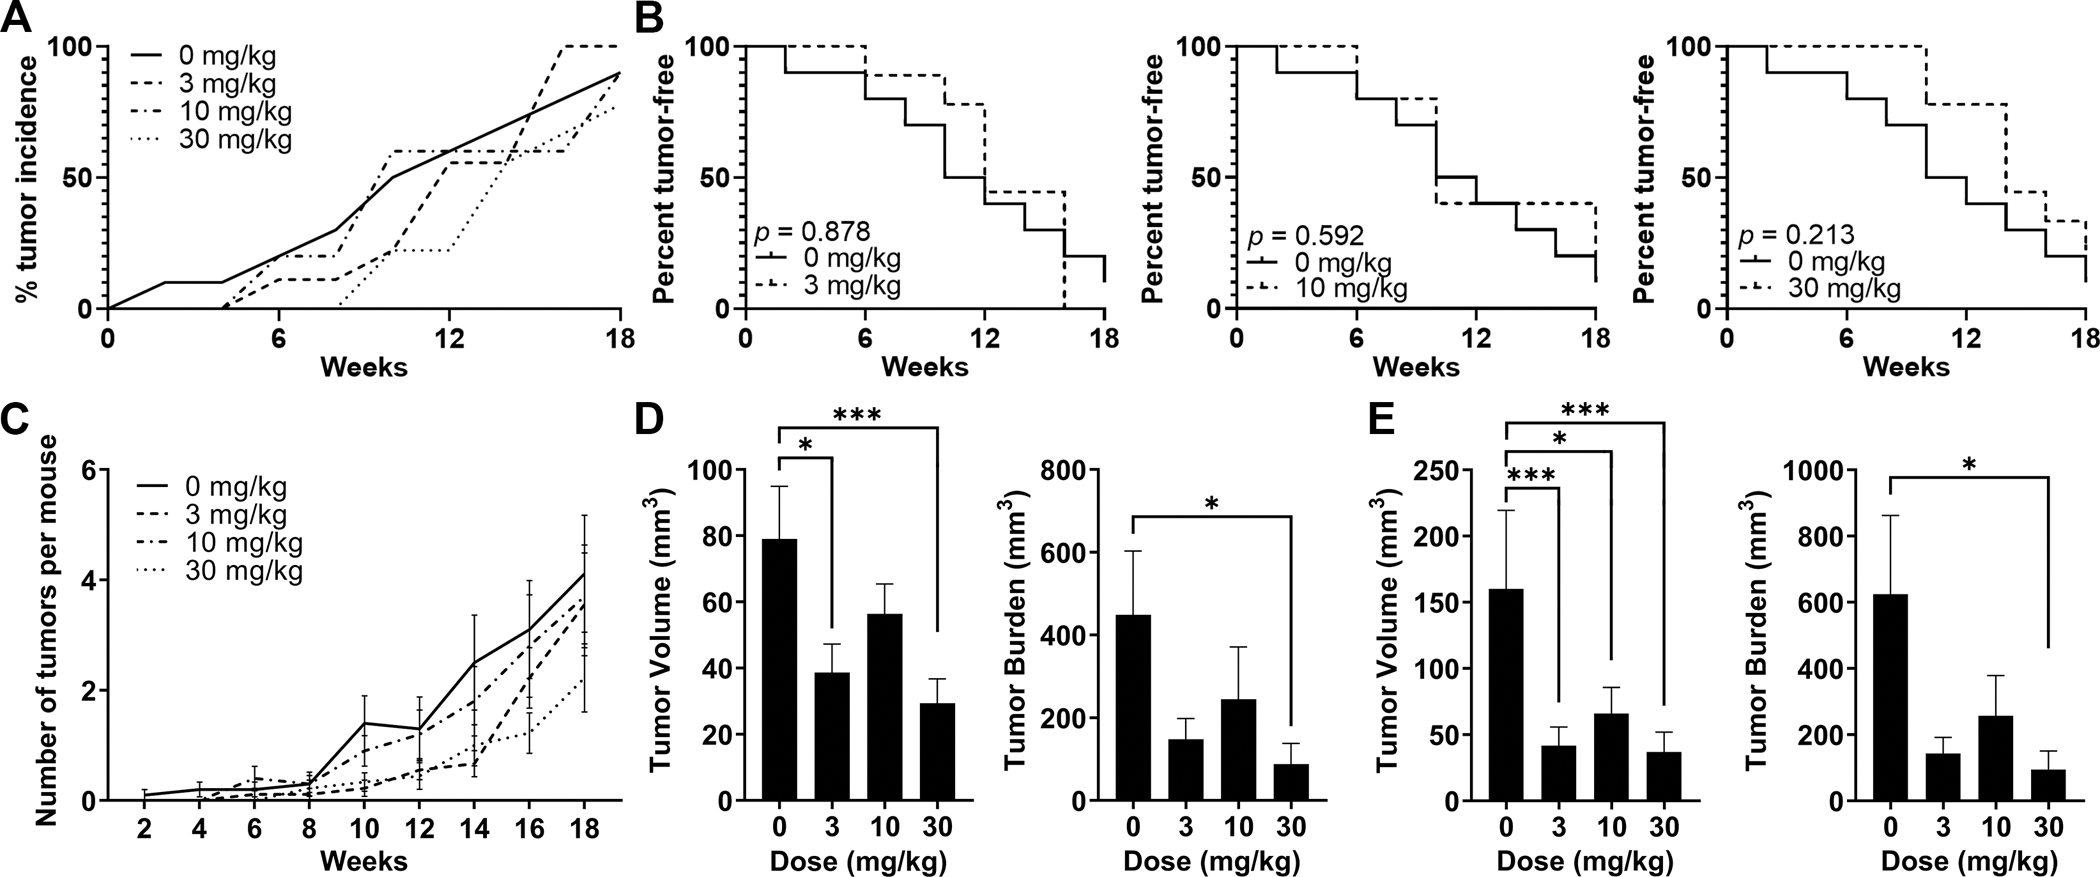
Figure 2. Prevention of liver tumor development by TAK-242 treatment in HepPten− mice.

Mice under treatment for 18 weeks received MRI scans every 2 weeks. Lesions >7.5 mm3 were included in the analysis. (A) Tumor incidence within each treatment group at each MRI timepoint. (B) Tumor-free survival curves for each TAK-242 treatment group compared to placebo. Significant differences between groups were assessed by the log-rank test. (C) Number of tumors per mouse detected at each MRI timepoint in each treatment group. Data are shown as mean, SEM. (D-E) Tumor burden and individual tumor volumes at end of treatment measured (D) by MRI, and (E) at necropsy. Tumor burden was calculated as the sum of all individual tumor volumes in each mouse. Significant differences between groups were assessed by the Mann-Whitney U test. * p<0.05, ** p<0.01, *** p<0.001.
