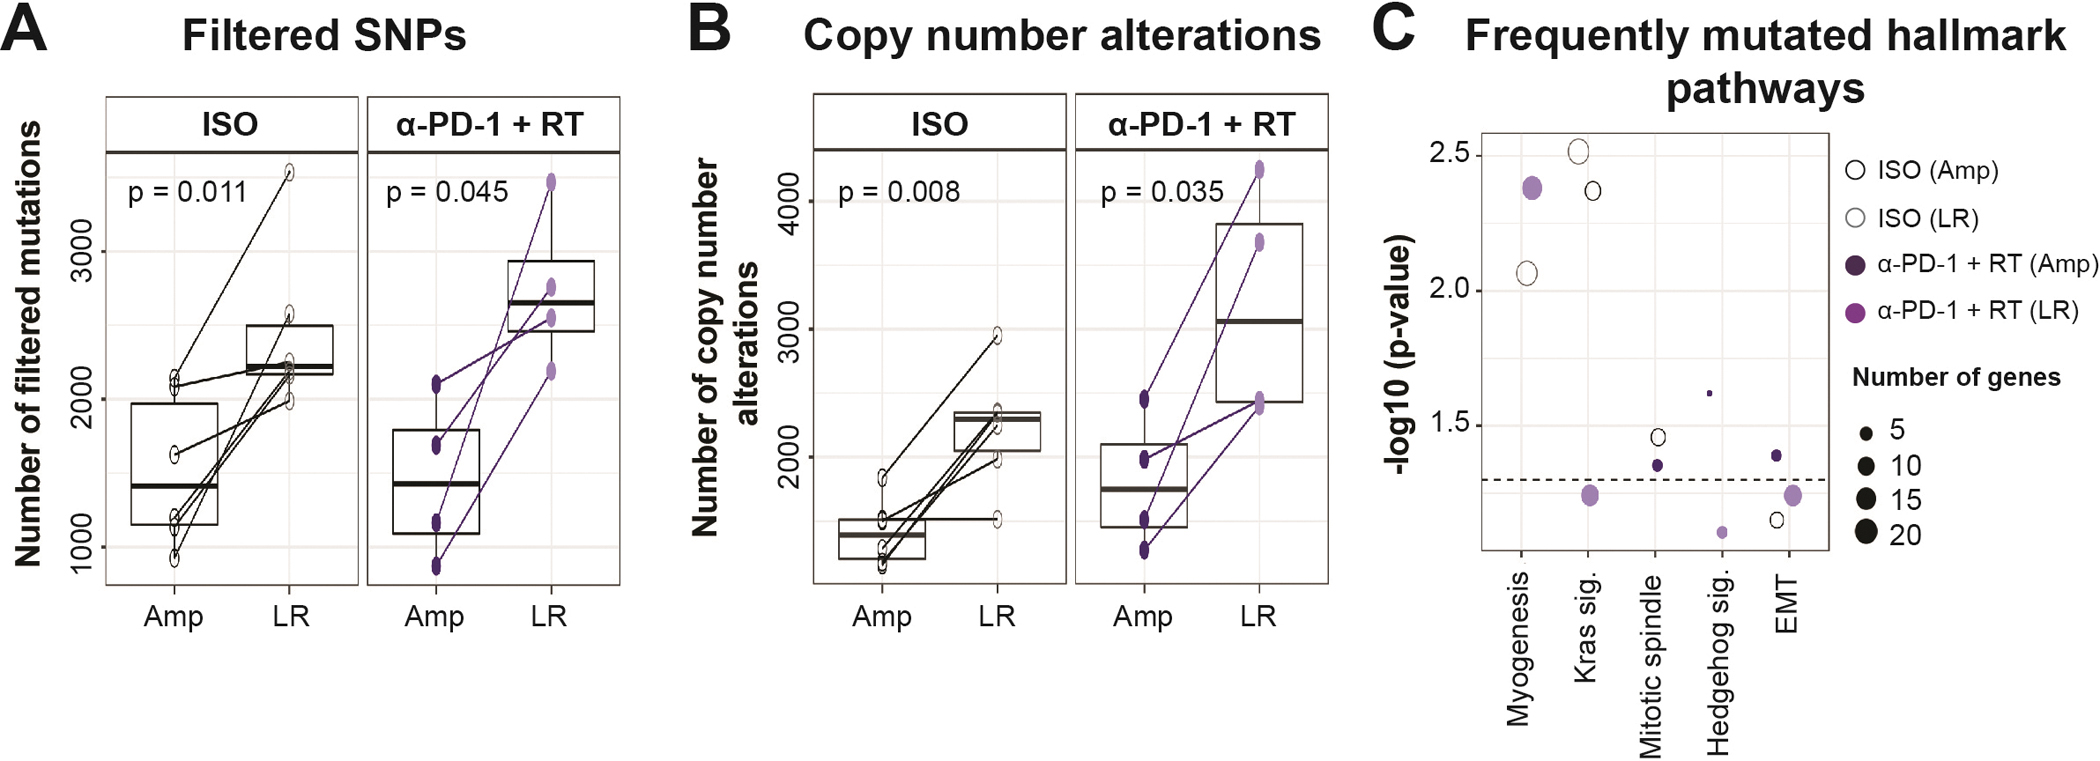
Figure 2:

Whole exome sequencing (WES) analysis of amputated versus locally recurrent sarcomas. Boxplots represent (A) Filtered SNPs (excluding silent, RNA, intronic, and unknown mutations), and (B) Copy number alterations (including gains and losses) by treatment status and tumor type. (C) Top frequently mutated hallmark pathways determined by hypergeometric test. WES included 4–6 sarcoma samples for each tumor type and treatment group. Amp – amputated tumor, LR – locally recurrent tumor, EMT – epithelial-mesenchymal transition. p-values in boxplots were determined by paired t-tests.
