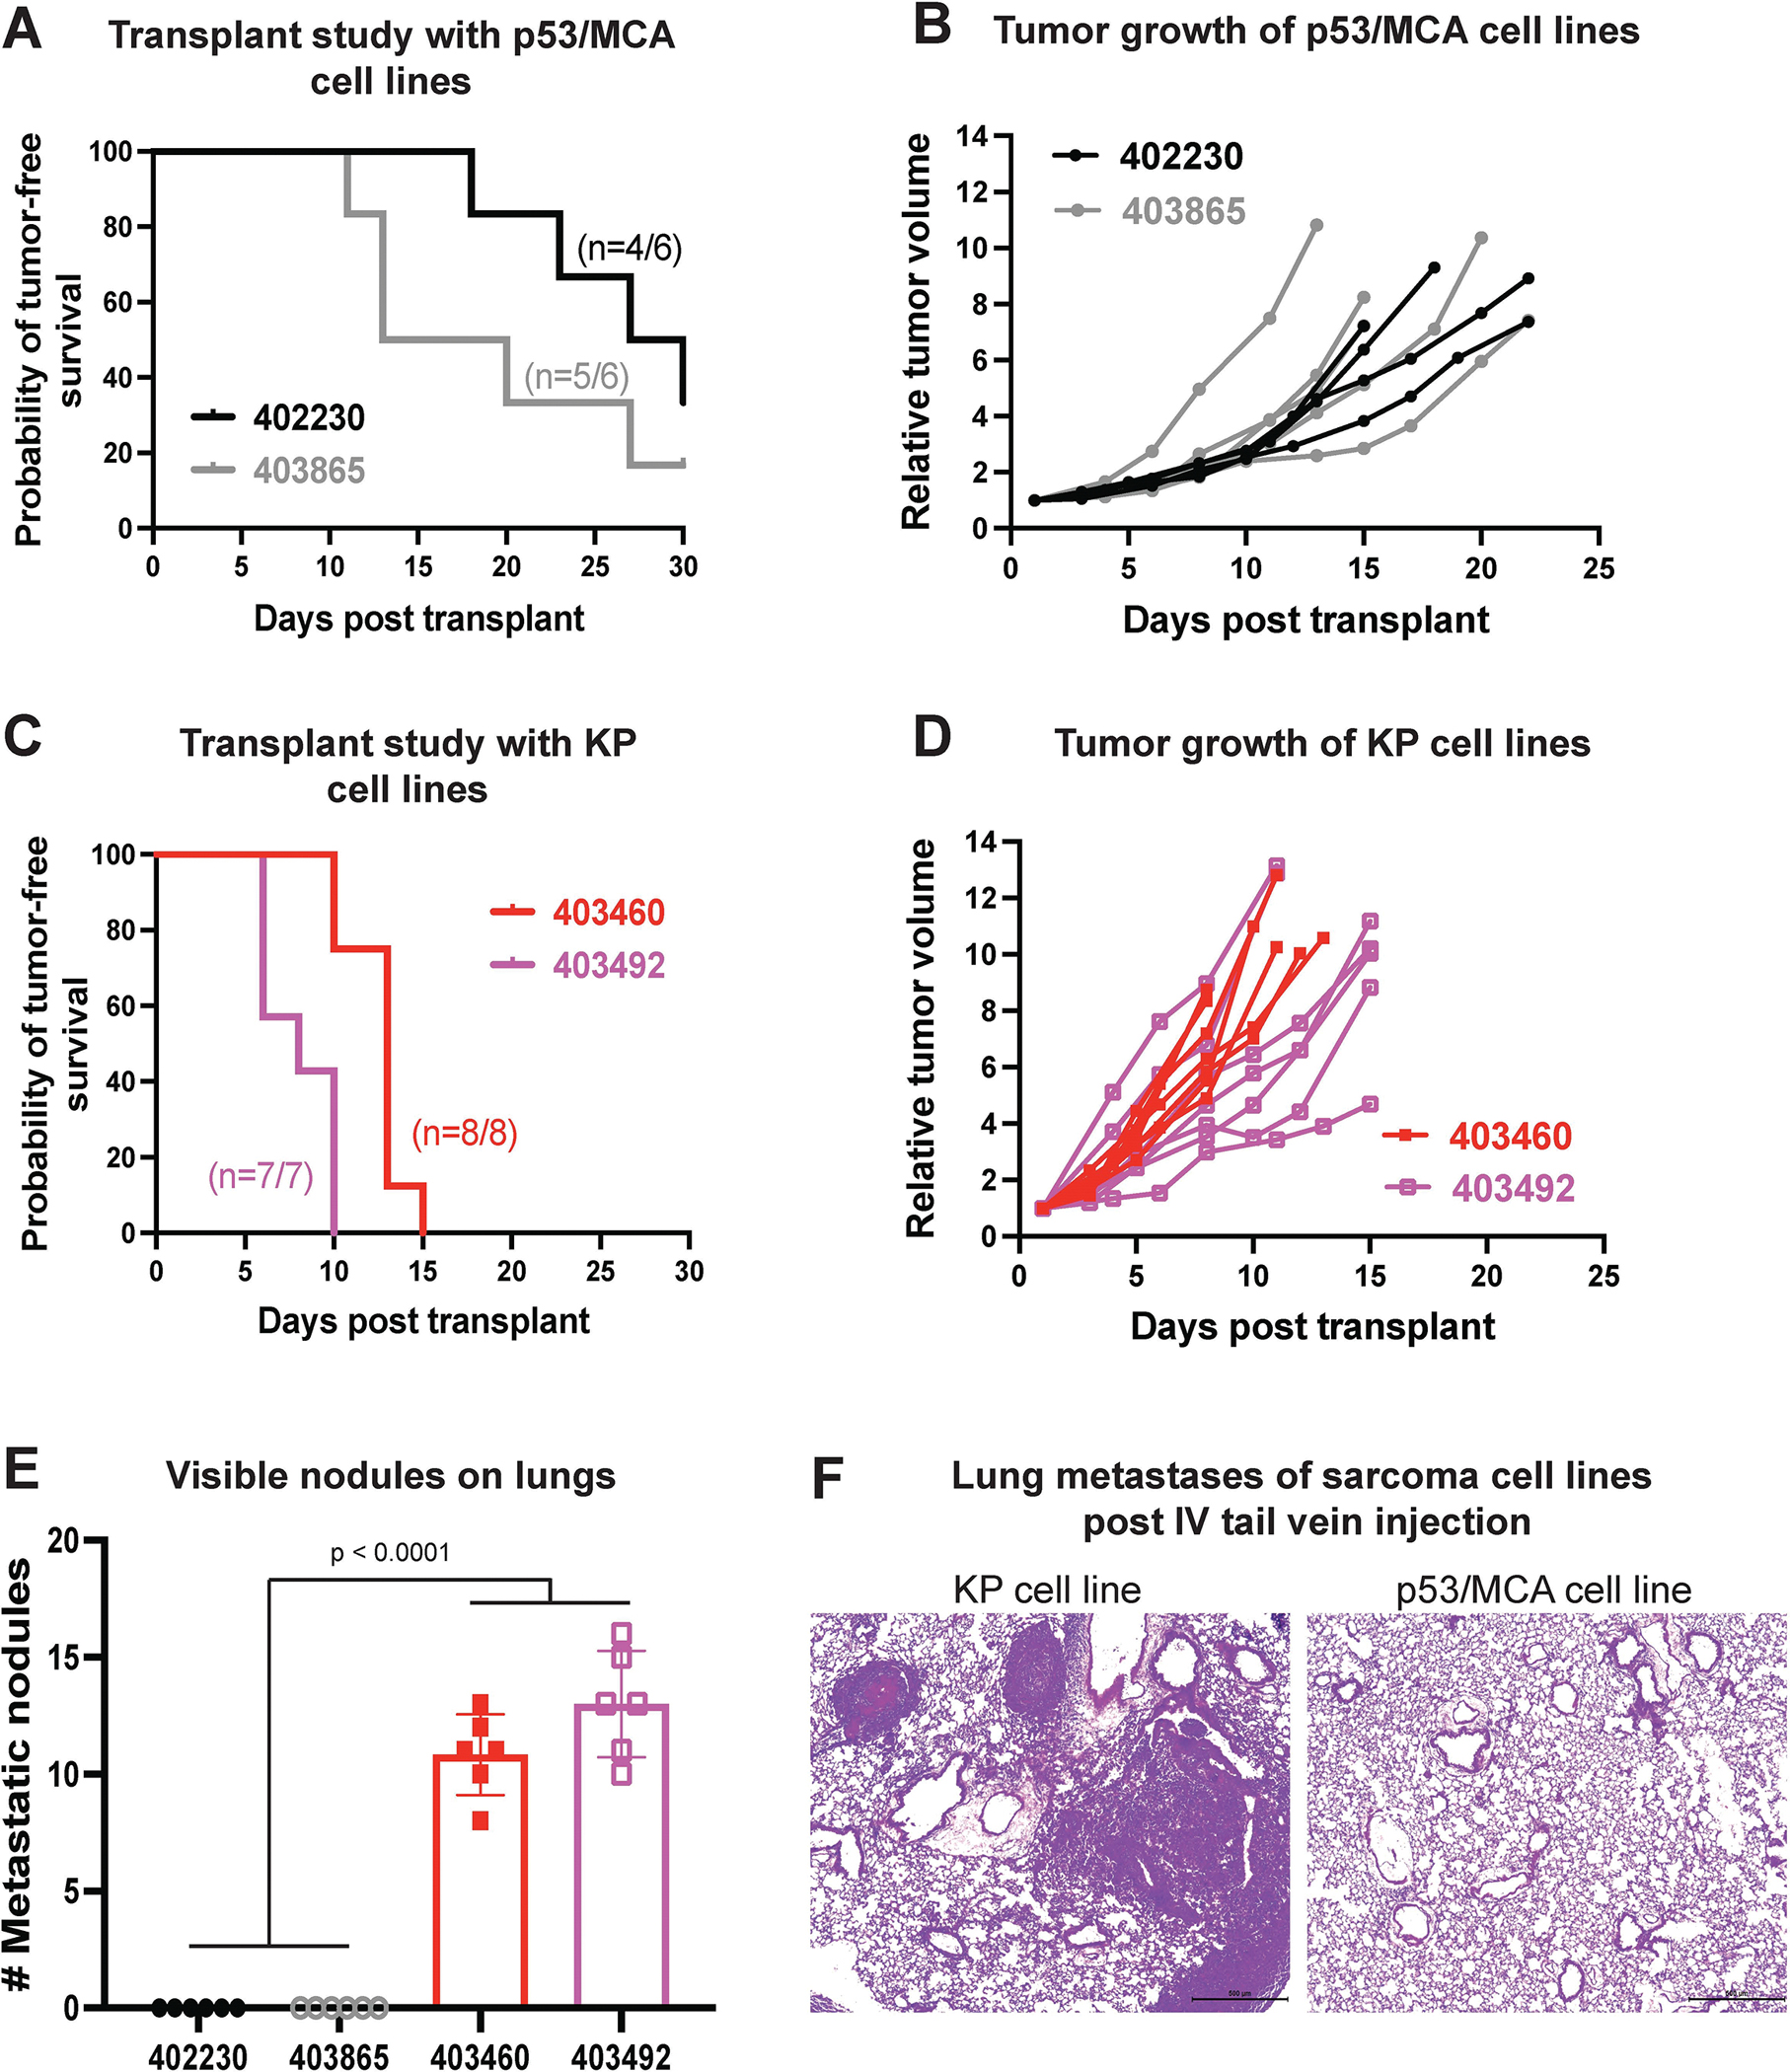
Figure 4:

Metastatic potential of sarcoma cell lines measured by intravenous injection of sarcoma cells into immunocompetent 129/SvJae mice. In vivo transplant study shows (A) rate of tumor initiation and (B) rate of tumor growth post intramuscular injection of p53/MCA sarcoma cell lines generated using CRISPR/Cas9 technology. In vivo transplant study shows (C) rate of tumor initiation and (D) rate of tumor growth post intramuscular injection of KP sarcoma cell lines generated using Cre-LoxP technology. (E) Bar graph represents the number of visible nodules detected in the lungs of mice that received either p53/MCA or KP sarcoma cells intravenously via tail vein injection. (F) Representative histological images of lung metastases of sarcoma cell lines post intravenous tail vein injection of either p53/MCA or KP cell lines. n = number of mice; data plotted are means ± SD; p-values were determined by student’s t-test in bar graph.
