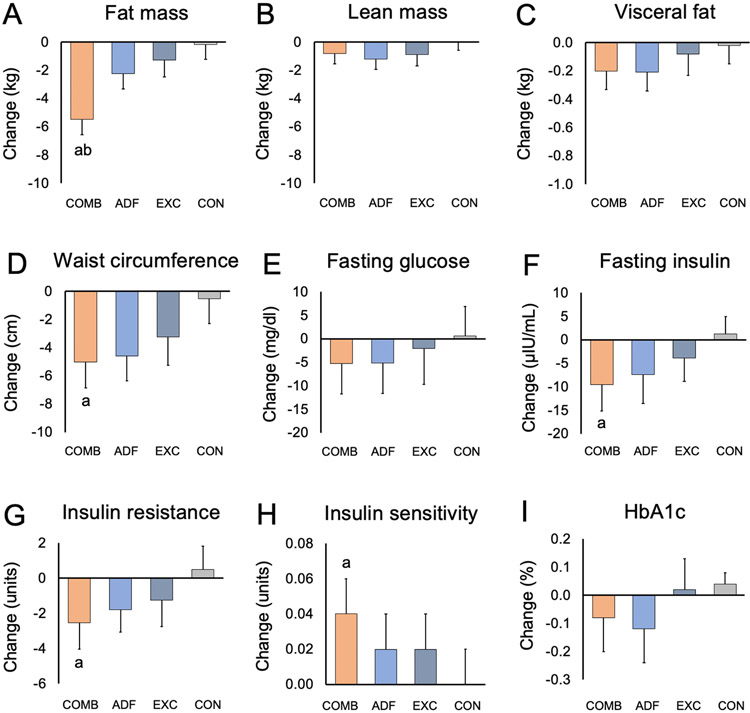
Figure 3. Body composition and glucoregulatory factors.
a P < 0.01 vs Control group; b P < 0.05 vs Exercise group. Data were included for 80 participants; means were estimated using an intention-to-treat analysis using a linear mixed model. Error bars indicate 95% confidence intervals for each parameter from baseline by diet group. Insulin resistance measured by HOMA-IR (Homeostasis model assessment of insulin resistance). Insulin sensitivity measured by QUICKI (Quantitative insulin sensitivity check index).

