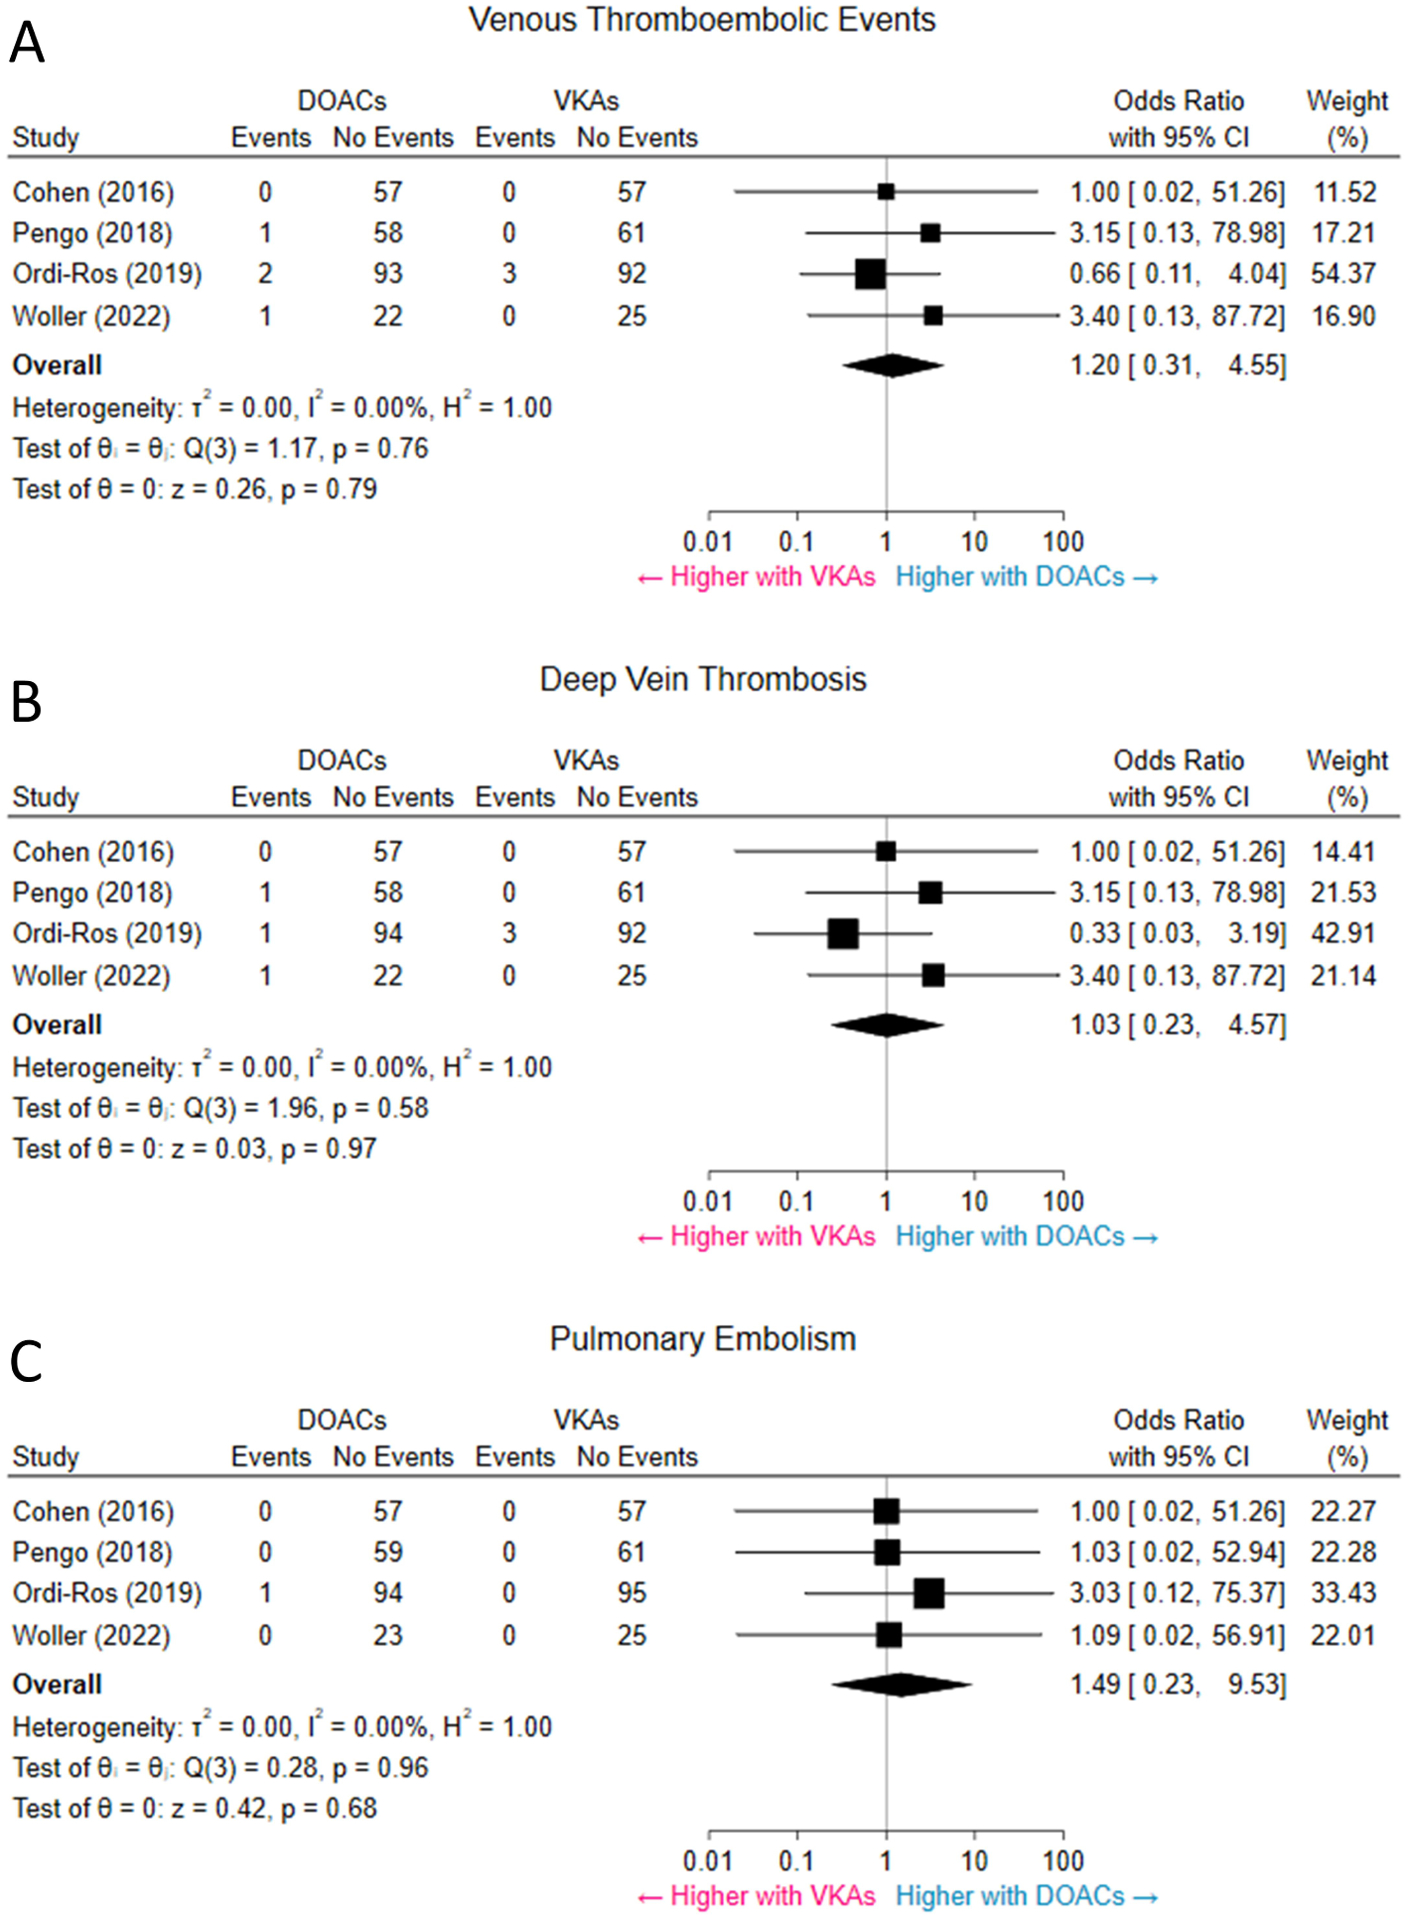
Figure 3. VTE (A), DVT (B), and PE (C).

Pooled results showed no significant difference in the rate of VTE between DOACs and VKAs. The rates of DVT and PE were not significantly different among the two groups, either. CI = confidence interval; DOACs = direct oral anticoagulants; DVT = deep vein thrombosis; PE = pulmonary embolism; VKAs = vitamin-K antagonists; VTE = venous thromboembolism.
