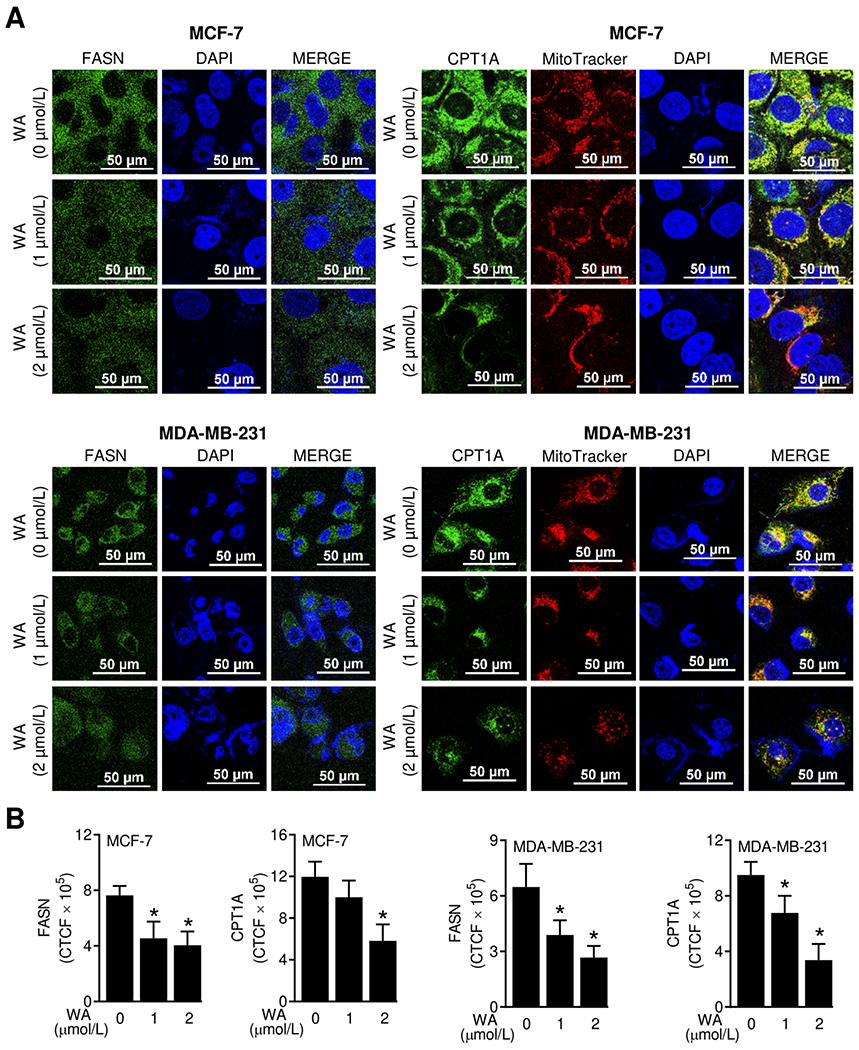
Figure 2.

WA treatment decreased protein levels of FASN and CPT1A in human breast cancer cells. (A) Representative confocal images (60× oil objective magnification, scale bar = 50 μm) for FASN and CPT1A proteins (green fluorescence) in MCF-7 or MDA-MB-231 cells following 24-hour treatment with DMSO (control) or WA. Nuclei and mitochondria were visualized by staining with DAPI (blue fluorescence) and MitoTracker Red (red fluorescence), respectively. (B) Quantitation of corrected total cell fluorescence (CTCF) using ImageJ software. The results shown are mean ± SD (n = 3). Statistically significant (*P < 0.05) compared with the DMSO-treated control by one-way ANOVA followed by Dunnett’s test. The experiment was repeated two times and the results were consistent.
