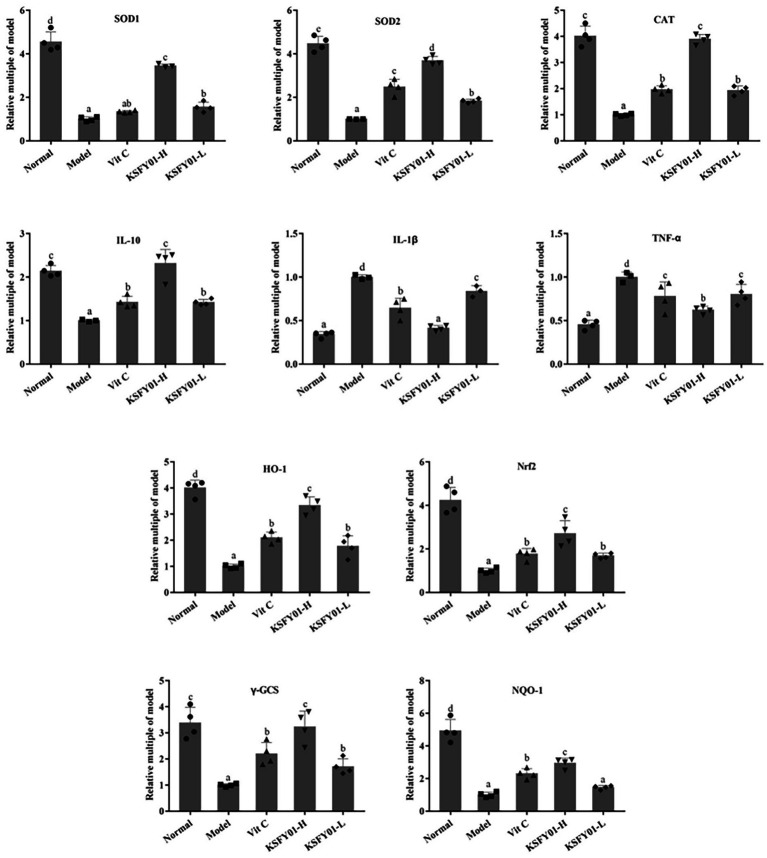
Figure 5.
The SOD1, SOD2, CAT, IL-1β, IL-10, TNF-α, HO-1, Nrf2, γ-GCS, and NQO-1 mRNA expressions in mouse liver tissue. a–eValues in the same column with different letter superscripts indicate significant difference (p < 0.05). Vit C, mice treated with vitamin C (200 mg/kg); KSFY01-H, mice treated with L. plantarum KSFY01 (1 × 10¹⁰ CFU/kg); KSFY01-L, mice treated with L. plantarum KSFY01 (1 × 10⁹ CFU/kg).

