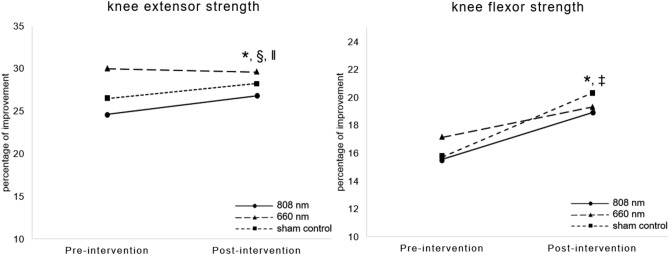
Figure 3.
Comparison of knee muscle strength between pre-and post-intervention among the 808 nm, 660 nm, and the sham control groups. * indicates a statistically significant difference between pre-and post-intervention in the 808 nm group, ‡ indicates a statistically significant difference between the pre-and post-intervention in the sham control, § indicates a statistically significant difference between the 808 nm and 606 nm group, and ‖ indicates a statistically significant difference between the 808 nm and the sham control group.

