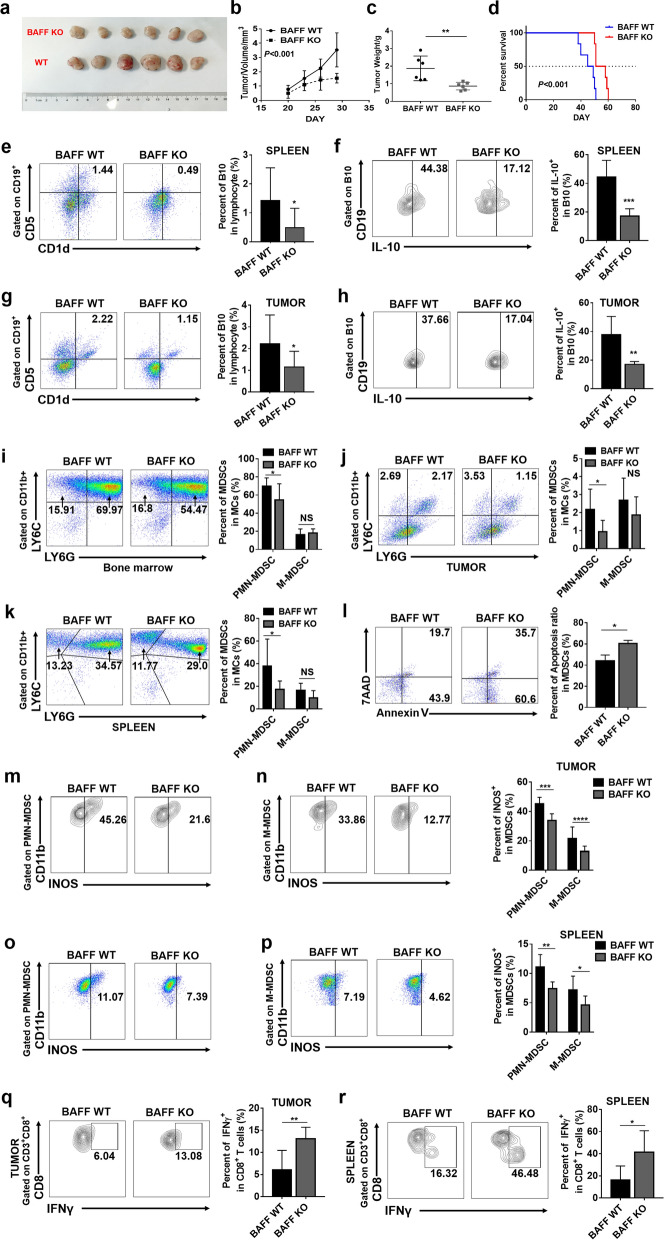
Figure. 3.
The absence of BAFF inhibited tumor growth and decreased the numbers of MDSCs and B10 cells. a TC1 cells were transplanted subcutaneously into the right back region of 6- to 8-week-old mice (1*106/100 μl/mouse). The survival time and tumor size were observed every 3 days. b, c Mice were sacrificed on the 28th day of tumor growth, at which point the tumor was removed for measurement and weighing. d The probability of overall survival was significantly different in BAFF WT and BAFF KO groups. Data was analyzed using log-rank (Mantel–Cox) test. e Spleen single-cell suspension was prepared and mononuclear cells were isolated for flow cytometry. The CD19-positive cells were first gated in lymphocytes, and then, CD1d and CD5 were used to gate B10 cells (CD19+ CD1d+ CD5+). Statistical analysis of the frequencies of B10 cells as a percentage of the single-cell suspension. f B10 cells in the spleen were first gated and then the percentage of IL-10+ B10 cells were detected. g Tumor single-cell suspension was prepared and mononuclear cells were isolated for flow cytometry. The CD19-positive cells were first gated in lymphocytes, and then, CD1d and CD5 were used to gate B10 cells (CD19+ CD1d+ CD5+). Statistical analysis of the frequencies of B10 cells as a percentage of the single-cell suspension. h B10 cells in the tumor were first gated and then the percentage of IL-10+ B10 cells were detected. i–k Single-cell suspension of tumor, spleen and bone marrow were prepared. The CD11b-positive cells were first identified, and then, PMN-MDSCs and M-MDSCs were gated. Statistical analysis of the frequencies of PMN-MDSCs and M-MDSCs as a percentage of the MDSCs population. l The percentage of Annexin V+ MDSCs represents the proportion of apoptotic MDSCs. m–p PMN-MDSCs and M-MDSCs were first gated, and then, the percentage of INOS+MDSCs were detected. q–r Representative IFN-γ+ CD8+ T cells flowchart are shown in tumor and spleen tissues from cervical cancer models. Data from at least nine independent experiments were analyzed using Student’s t test and are expressed as the mean ± SD. Symbols represent statistical significance (*p < 0.05)

