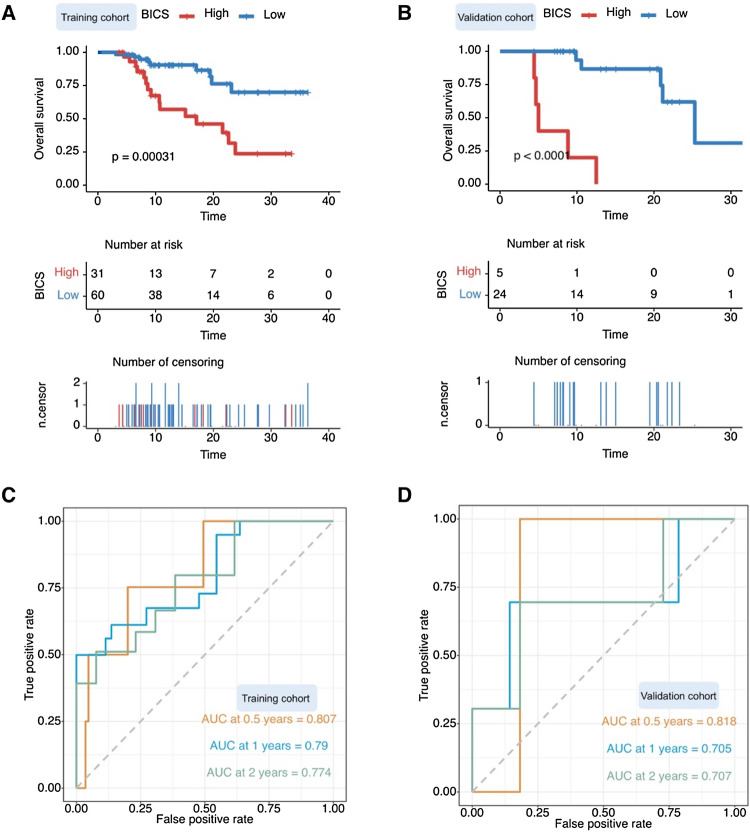
Fig. 2.
A Kaplan–Meier analysis showed that patients with a higher BICS exhibited a worse OS in the training cohort. B Kaplan–Meier analysis showed that patients with a higher BICS exhibited a worse OS in the validation cohort. C Time-dependent ROC curve at 0.5-, 1-, and 2-year OS for BICS in the training cohort (0.5-year AUC = 0.807, 1-year AUC = 0.79, and 2-year AUC = 0.774). D Time-dependent ROC curve at 0.5-, 1-, and 2-year OS for BICS in the validation cohort (0.5-year AUC = 0.818, 1-year AUC = 0.705, and 2-year AUC = 0.707). BICS: peripheral-blood-immune-cell-based signature; AUC: area under the curve

