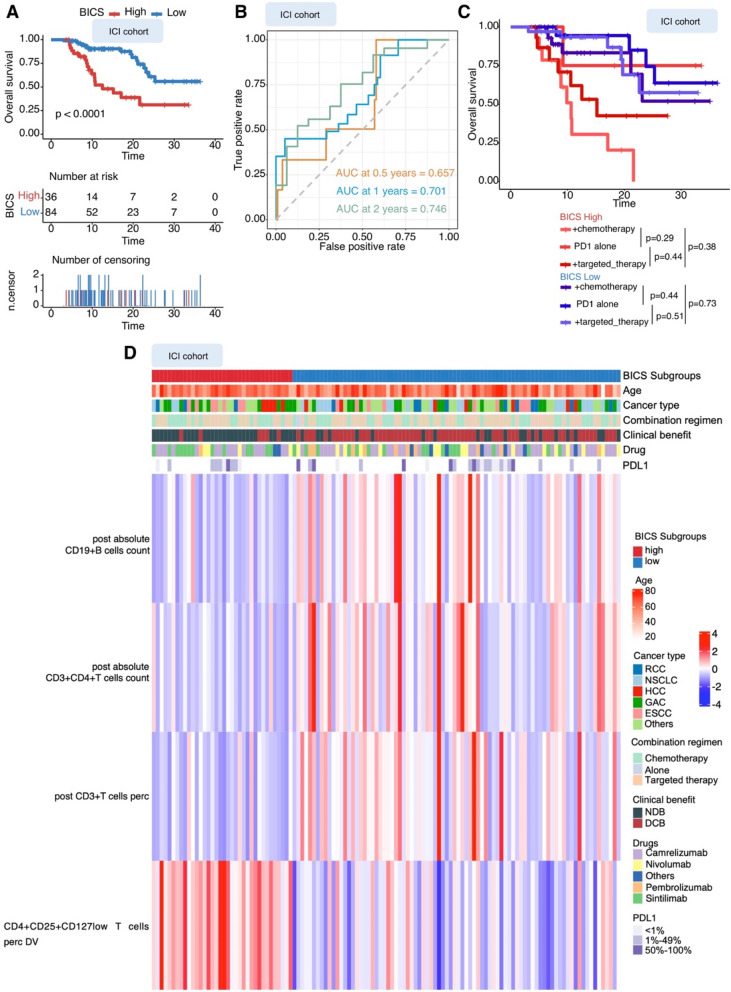
Fig. 4.
A Kaplan–Meier analysis showed that patients with a higher BICS exhibited a worse OS in the ICI cohort. B Time-dependent ROC curve at 0.5-, 1-, and 2-year OS for BICS in the ICI cohort (0.5-year AUC = 0.657, 1-year AUC = 0.701, and 2-year AUC = 0.746). C OS from the start of therapy stratified by BICS in patients in the ICI cohort treated with PD-1 single-agent blockade, PD-1 and chemotherapy combination therapy, or a combination of PD-1 and targeted therapy. D Clustered heatmap showing the four immune-related PBIMs that classify patients (represented in columns) into DCB or NDB groups. BICS: peripheral-blood-immune-cell-based signature; ICIs: immune checkpoint inhibitors; AUC: area under the curve; PD-1: programmed death 1; PD-L1: programmed death 1 ligand; DCB: durable clinical outcomes; NDB: no durable benefit; RCC: renal cell carcinoma; ESCC: esophageal squamous cell carcinoma; GAC: gastric adenocarcinoma; SCLC: small-cell lung cancer; NSCLC: non-small cell lung cancer; HCC: hepatocellular carcinoma

