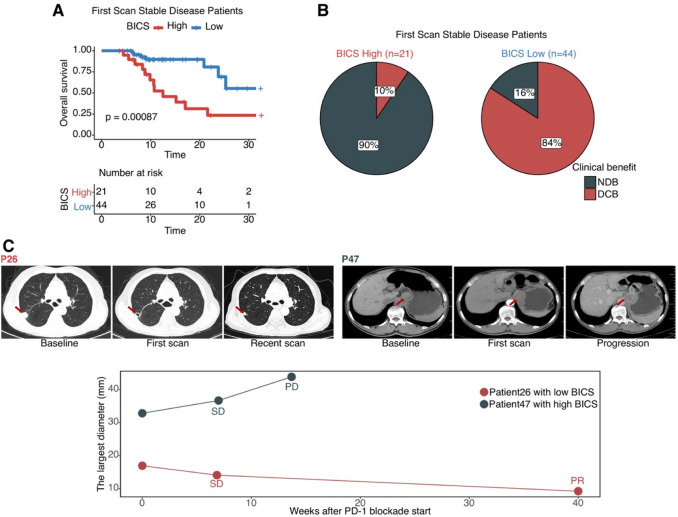
Fig. 5.
A Kaplan–Meier analysis showed that patients with RECIST SD at the first scan with a higher BICS exhibited a worse OS in the ICI cohort. B Pie charts demonstrate the proportions of patients with RECIST SD at the first scan. The analysis is split by those patients with a high BICS (n = 21) versus those with a low BICS (n = 44). C P26: Vignette for a patient with low BICS and SD at the first scan. P47: Vignette for a patient with high BICS and SD at the first scan. BICS: peripheral-blood-immune-cell-based signature; PD: progressive disease; PR: partial response; SD: stable disease; DCB: durable clinical outcomes; NDB: no durable benefit

