
Fig. 5.
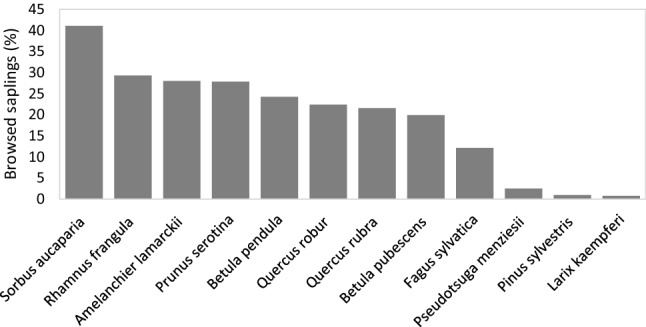
Representation of the total percentage of browsed saplings discriminated by species across the ten forest sites in the Veluwe, the Netherlands. The average number of assessed trees per species = 1630 (range 402–4394)
Official websites use .gov
A
.gov website belongs to an official
government organization in the United States.
Secure .gov websites use HTTPS
A lock (
) or https:// means you've safely
connected to the .gov website. Share sensitive
information only on official, secure websites.
Representation of the total percentage of browsed saplings discriminated by species across the ten forest sites in the Veluwe, the Netherlands. The average number of assessed trees per species = 1630 (range 402–4394)