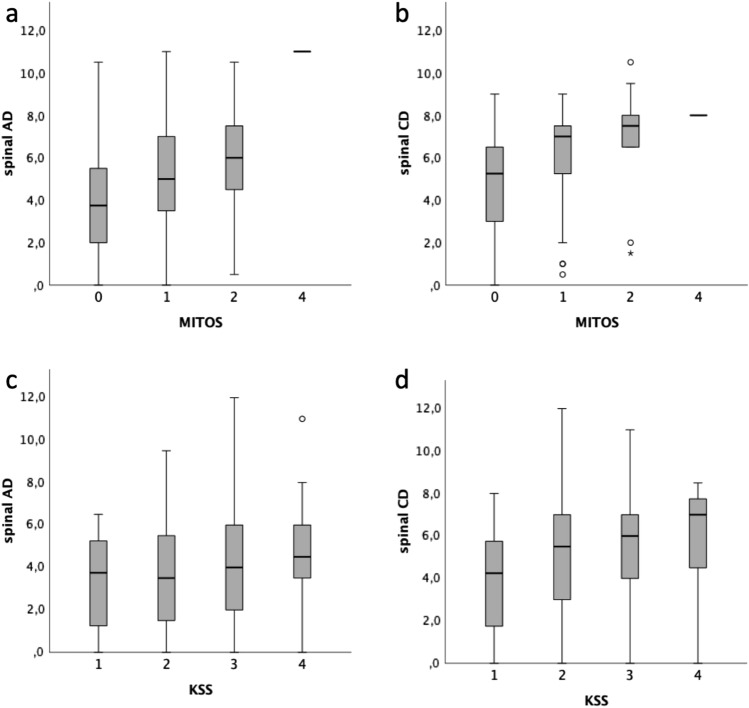
Fig. 3.
Correlation between MITOS stages and spinal AD (p = 6.4 × 10⁻⁷) and CD (p = 1.9 × 10⁻⁷) scores (a and b) and between King’s stages (KSS) and spinal AD (p = 0.025) and CD (p = 0.001) scores (c and d). For each group the bold line shows the median, the grey boxes includes the middle 50% of the data and whiskers show the minimum and maximum values. Empty circles and asterisks represent outliers. Kruskal–Wallis test for independent samples

