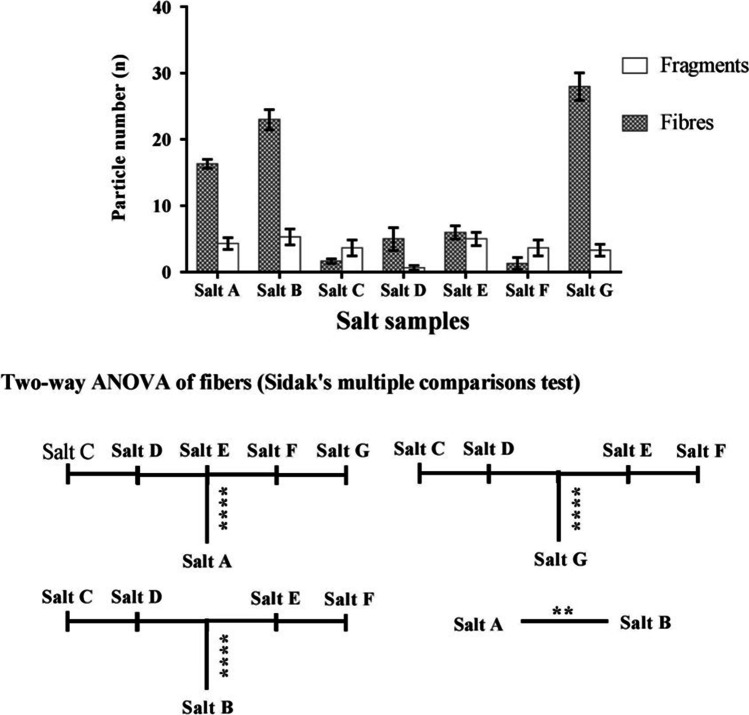
Fig. 4.
Comparison of fragments and fibres in different commercial salt samples (in 180 g of salt sample). Adjusted p value: ****p < 0.0001, **p = 0.0078. Fibre number in salt A was statistically significant to fibre number in salts C, D, E, and F (p < 0.0001). Fibres in salt G were statistically significant with fibres in salts C, D, E, and F (p < 0.0001). Similarly, fibre number in salt B was statistically significant with fibres in salts C, D, E, and F (p < 0.0001). Finally, fibres in salt A were statistically significant with fibre number in salt B (p = 0.0078)

