Fig. 1.
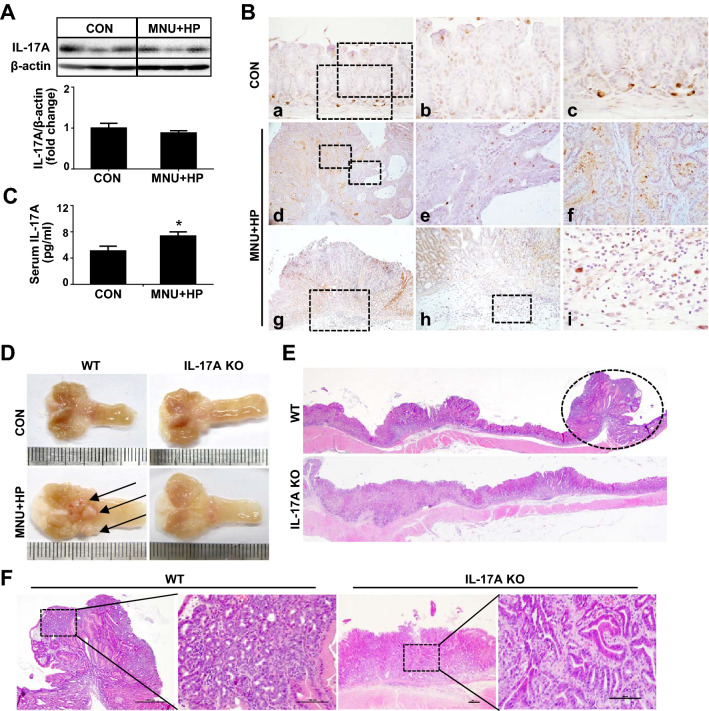
IL-17A deficiency suppresses H. pylori-induced gastric cancer. A Western blot analysis of IL-17A in gastric tissues of control and MNU and H. pylori treated WT mice. B Immunoreactivity of IL-17A in stomach tissues of control and MNU and H. pylori-treated WT mice. The low magnification (X200) of gastric tissues of control mice (a). The high magnification (X400) of (a) shows surface mucous (b) and gastric glands (c). The low magnification (X40) of gastric cancer of MNU and H. pylori-treated WT mice (d). The high magnification (X400) of (d) shows tumor (e) and adjacent non-tumor (f) lesions. No IL-17A positivity was observed in tumor cells, but strong immunoreactivity was found in proliferating and metastatic gastric cells. The low magnification (X40) of the stomach of MNU and H. pylori-treated WT mice (g). The high magnification of (g) shows submucosa (X100, h) and infiltration of inflammatory cells (X400, i). Note the strong IL-17A immunoreactivity in the cytoplasm of inflammatory cells. C Serum concentrations of IL-17A in control and MNU and H. pylori-treated WT mice. D Macroscopic images of control and MNU/H. pylori-treated stomach tissues of WT and IL-17A KO mice. Growth of polypoid to sessile masses pinkish in color (arrows) in stomachs of MNU and H. pylori-treated WT mice. E Hematoxylin and eosin H and E staining of MNU and H. pylori-treated WT and IL-17A KO stomach tissues. Neoplastic nodules (circles) showing a polypoid appearance in the antrum (original magnification = ×10). F Magnification of neoplastic nodules. Boxed regions of left panels (original magnification = ×40) are shown at a higher magnification (original magnification = ×200) in the right panels. Nodules in WT mouse stomach consist of pleomorphic tumor cells showing a sessile growth pattern, with invasion to submucosa. Nodules in IL-17A KO mouse stomach show glandular and tubular growth patterns composed of well-differentiated tumor cells. Data are expressed as mean ± SEM. *P < 0.05 versus control

