Figure 1.
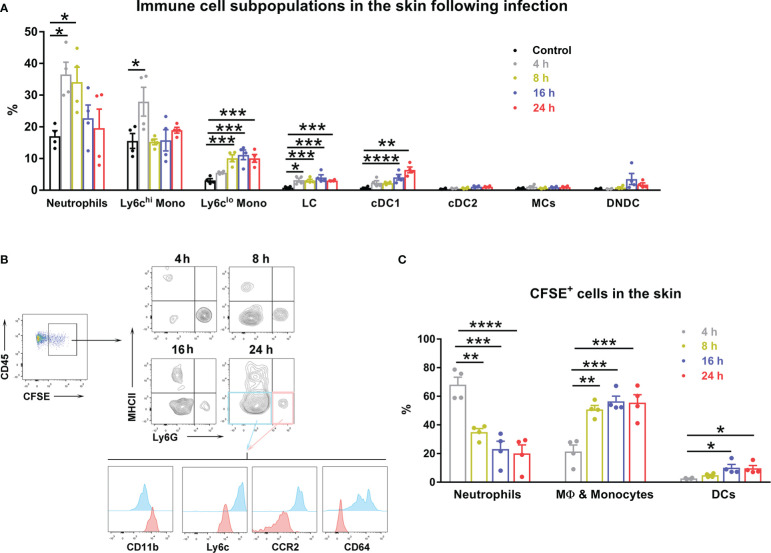
Innate immune cells displayed a dynamic pattern at the inoculation site of Ot infection. B6 mice (n=4/group) were intra-dermally (i.d.) infected with CFSE-labeled Ot (4×10³ FFU) in the ears. Skin tissue was harvested at indicated time-points, digested by collagenase, and prepared for single cell suspension. Control mice were euthanized immediately after injection. (A) The dynamic pattern of innate immune cell subpopulations infiltrating the inoculation site is displayed. (B) CD45+ and CFSE+ positive immune cells from infected mice were further characterized by immune cell types using surface markers. MHCII+ cells were considered antigen presenting cells including cDC1 (MHCIIhiCD24hiCD64-EpCAM-), cDC2 (MHCIIhiCD172ahiCD11b+CD64-EpCAM-), DN (double negative) DC (CD11b-MHCIIhiCD24-CD64-EpCAM-), and Langerhans cells (MHCIIhiCD24hiEpCAM+). Monocyte-derived inflammatory cells (MC) were identified as MHCII+CD11bhiCD64hiLy6C-. MHCII-Ly6G+ cells (pink quadrant), which were also CD11bhiLy6CintCCR2intCD64-, were characterized as neutrophils. MHCII-Ly6G- cells (blue quadrant) were identified as macrophages and monocytes, as they were CD11bintLy6C+CCR2hiCD64+. (C) The dynamic pattern of Ot infected-immune cells at the site of Ot inoculation 4 h post-infection is shown. Values are shown as mean ± SEM from single experiments and are representative of two independent experiments. A one-way ANOVA with a Tukey’s multiple comparisons test was used for statistical analysis. *, p<0.05; **, p<0.01; ***, p <0.001; ****, p <0.0001.

