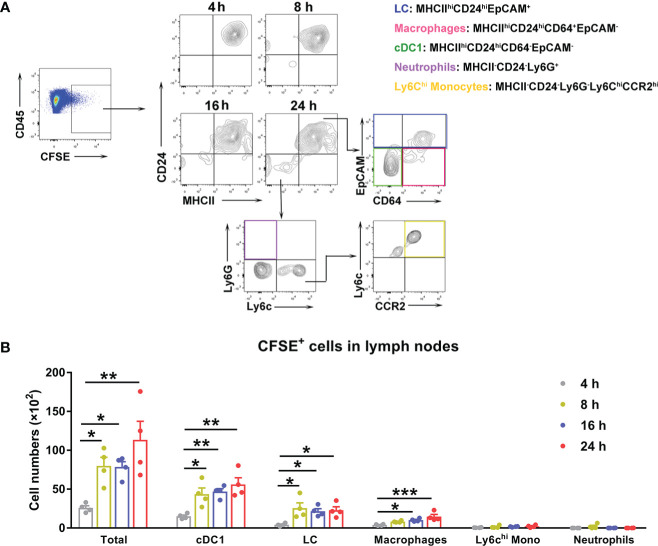
Figure 4.
Ot infected dendritic cells and macrophages, which migrated to draining lymph nodes in mice. B6 mice (n=4/group) were i.d. infected with CFSE-labeled Ot (4×10³ FFU) in the ears. dLN were harvested at indicated time-points, and prepared for single cell suspension, followed by flow cytometric analysis. (A) Live cells were sorted by live/dead dye staining, and Ot-infected immune cells were identified by expression of CD45+CFSE+. We determined that Ot infected the following immune cell subpopulations: Langerhans cells (MHCIIhiCD24hiEpCAM+), macrophages (MHCII+CD24hiCD64+EpCAM-), conventional dendritic cells (MHCIIhiCD24hiCD64-EpCAM-), neutrophils (MHCII-CD24-Ly6G+), and Ly6Chi monocytes (MHCII-CD24-Ly6G-Ly6ChiCCR2hi). (B) The absolute Ot-infected cell numbers in dLN were calculated. Values are shown as mean ± SEM from single experiments and are representative of two independent experiments. A one-way ANOVA with Tukey’s multiple comparisons test was used for statistical analysis. *, p<0.05; **, p<0.01; ***, p <0.001.

