Figure 5.
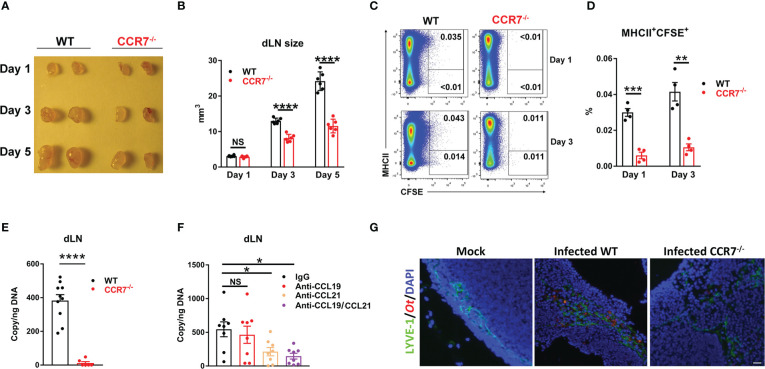
CCR7 knockout resulted in reduced bacterial dissemination into draining lymph nodes in mice. WT and CCR7-/- mice (n=4-6/group) were i.d. infected with CFSE-labeled Ot (4×10³ FFU) in the ears. (A) dLN were harvested at indicated time-points and (B) the sizes of dLN were quantified. (C, D) Single cell suspension was prepared from dLN at days 1 and 3, followed by the flow cytometric analysis of Ot-infected dendritic cells (defined as MHCII+CFSE+). (E) Bacterial loads in dLN of WT and CCR7-/- mice (n=10/group) were quantified at day 3 by qPCR. (F) B6 WT mice (n=8/group) were i.d. injected with anti-CCL19 (2 µg), anti-CCL21 (2 µg) or both (2 µg/each, 4 µg total) at 1 day prior to infection. Goat IgG was used as a control or supplemented to reach equal amount of antibody (4 µg total) per injection. Mice were infected with CFSE-labeled Ot (4×10³ FFU) in the ears and dLN were harvested at day 3 for bacterial load quantification. (G) dLN were collected from Ot-infected mice at day 5 and were processed for immunofluorescent staining. dLN tissue was stained for lymphatic endothelial cells (LYVE1, green), Orientia (TSA56, red) and DAPI (blue). Images were acquired by an Olympus IX73 inverted microscope. The scale bar is 20 µm. A one-way ANOVA with a Tukey’s multiple comparisons test is used for statistical analysis. A two-tailed Student’s t-test is used for comparison of two groups. *, p<0.05; **, p<0.01; ***, p <0.001; ****, p < 0.0001; NS, no significant difference.

