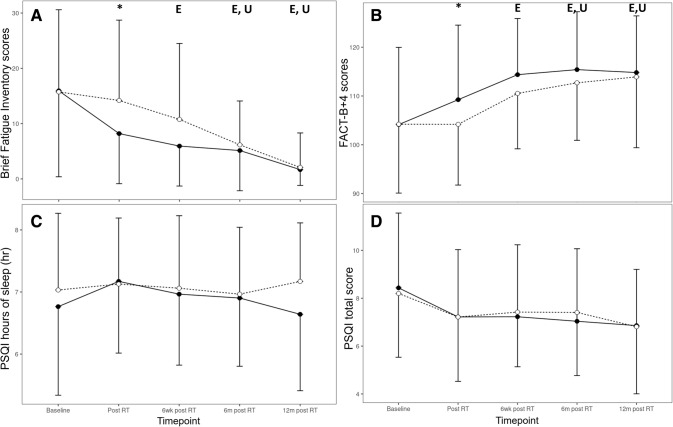
Fig. 5.
A Brief Fatigue Inventory, B FACT-B + 4, C Pittsburg Sleep Quality Index hours of sleep, D Pittsburg Sleep Quality Index total score for all time points (baseline, post-RT, and 6 weeks, 6 months, and 12-month post-RT) for both groups. Exercise: straight line and black circles; usual care: dashed line and white circles. Characters denote significant difference of either the exercise (E) or the usual care (U) groups with their respective baselines, and *denotes significant difference between groups (p < 0.05). Error bars denote standard deviation of the mean

