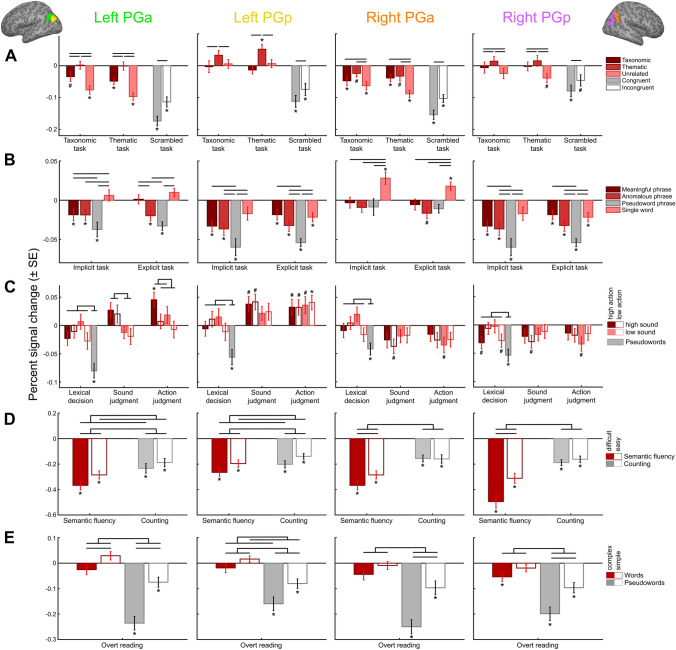
Fig. 2.
Response profiles of each AG subregion for every study. Mean percent signal change as compared to the resting baseline is plotted for each experimental condition (grouped by task). Error bars represent standard error of the mean. Semantic conditions are highlighted in red; non-semantic conditions are in gray. Black bars illustrate significant differences between experimental conditions. *p < 0.05 (Bonferroni-Holm corrected); #p < 0.05 (uncorrected)

