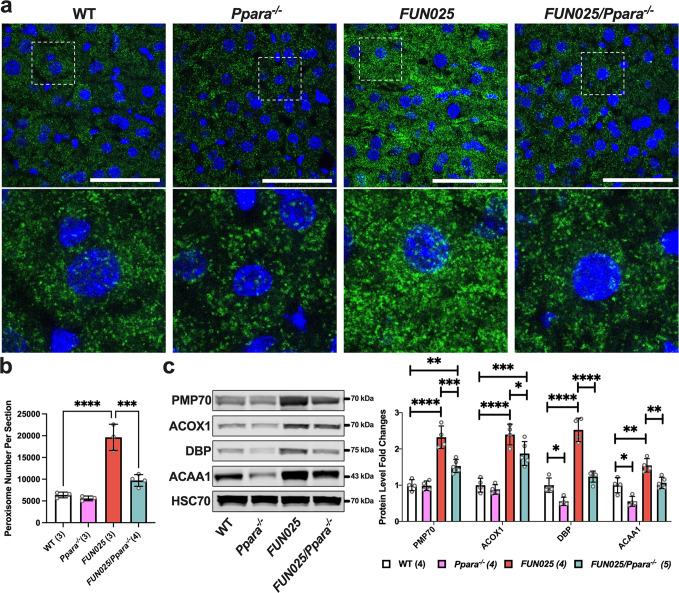
Fig. 6. Tmem135 mutation activates peroxisome proliferator-activated receptor alpha (PPARa) in the mouse liver.
a Representative 100x immunohistochemical images of PEX14 labeled (green) and DAPI stained (blue) 3-month-old WT, Ppara−/−, Tmem135FUN025/FUN025 (FUN025), and Tmem135FUN025/FUN025/Ppara−/− (FUN025/Ppara−/−) livers. The white boxes in these images were expanded to highlight differences of the PEX14-positive peroxisome staining between these genotypes. Scale bar for images = 50 microns. b Quantitation of PEX14-positive peroxisomes from the 100x images of WT (1 male/ 2 females), Ppara−/− (1 male/2 females), Tmem135FUN025/FUN025 (1 male/2 females), and Tmem135FUN025/FUN025/Ppara−/− (1 male/ 3 females) livers using the Analyze Particles function in ImageJ. c Western blot analysis of peroxisomal proteins in the livers of 3-month-old WT (3 males/1 female), Ppara−/− (2 males/2 females), Tmem135FUN025/FUN025 (2 males/2 females), and Tmem135FUN025/FUN025/Ppara−/− (3 males/2 females) mice. HSC70 served as the loading control for these experiments. Asterisks (*, **, ***, and ****) indicates post hoc Tukey test for a P < 0.05, P < 0.01, P < 0.001, and P < 0.0001 significance following a significant difference detected by one-way ANOVA. PMP70, peroxisomal membrane protein 70. ACOX1, acyl-CoA oxidase 1. DBP, D-bifunctional protein. ACAA1, acetyl-Coenzyme A acyltransferase 1. Dots represent individual data points. Number in parentheses represents N of independent mouse samples per genotype used in the experiment. The protein size next to the immunoblot images denotes the size of the immunoband measured for this analysis. Data are presented as mean ± SD.

