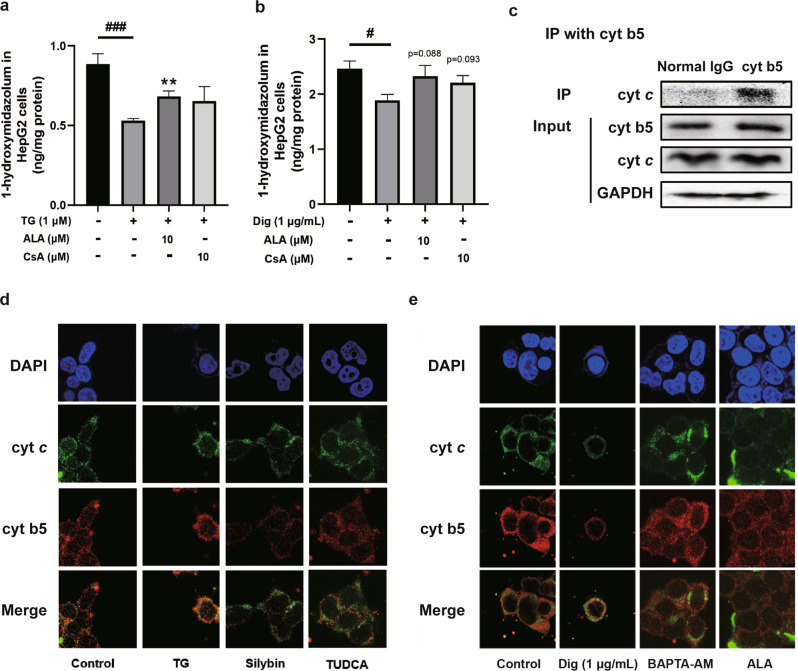
Fig. 6. Effect of cytochrome c on the P450s activity.
Analysis of CYP3A activity in cells through HPLC–MS/MS after treatment with thapsigargin (TG), digitonin (Dig), ALA, and CsA (a, b). Interaction between cyt b5 and cyt c was determined by immunoprecipitation with an anti-cytochrome c antibody and immunoblotted with antibodies against cyt b5 and GAPDH (c). Representative confocal microscopy images (60×) of nuclei (Blue), cytochrome b5 (cyt b5) (Red) and cytochrome c (cyt c) (Green) in HepG2 cells treated with 1 μM thapsigargin (TG), 50 μM silybin and 100 μM TUDCA (d) as well as 1 μg/mL digitonin, 10 μM BAPTA-AM and 10 μM ALA (e). The data were presented as the means ± SEM (n = 5). Statistical analysis was performed by two-tailed paired t test. **P < 0.01 vs. model, #P < 0.05 ###P < 0.001 vs. control.

