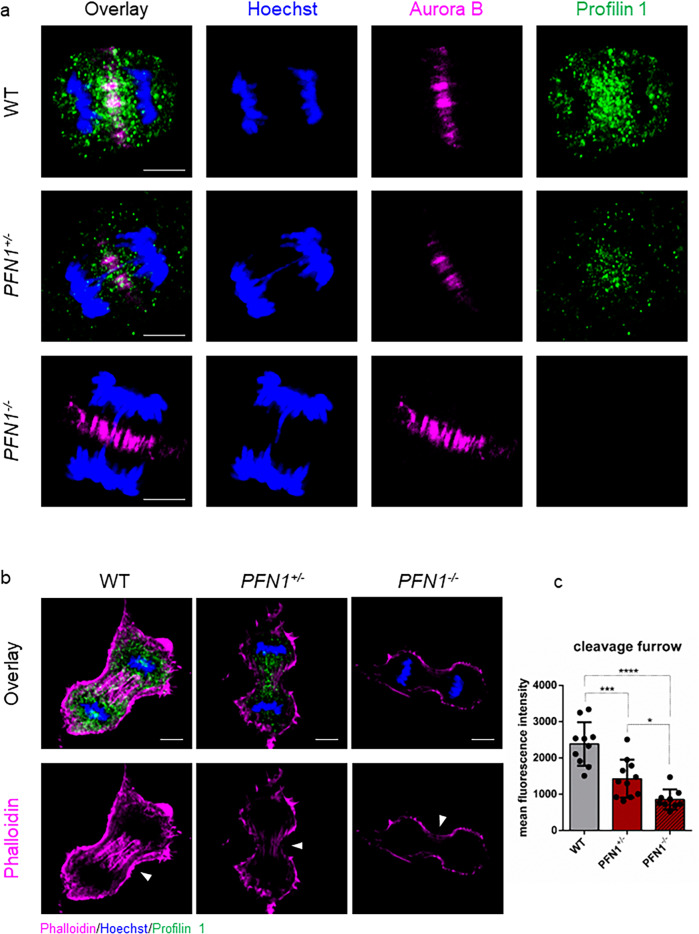
Fig. 2. Profilin 1 localises in the mitotic midzone and promotes actin polymerisation at the cleavage furrow.
a WT, PFN1+/− and PFN1−/− RPE1 cells at anaphase stained for DNA (Hoechst 33342, blue), a midzone marker (Aurora B kinase, magenta) and Profilin 1 (green); scale bars 5 μm. Note that PFN1-KO cells show normal Aurora B localisation. b WT, PFN1+/− and PFN1−/− RPE1 cells at telophase stained for DNA (Hoechst 33342, blue), Profilin 1 (green) and F-actin (phalloidin, magenta). Arrowheads point towards furrow ingression; scale bars 5 μm. c Mean fluorescence intensity of phallodin staining at the cleavage furrow; data are shown as mean ± s.e.m.; dots represent the fluorescent intensity for each sample (n = 10 for WT, 11 for PFN1+/−, 9 for PFN1−/− cells); ***P = 0.0004, ****P < 0.0001, *P = 0.0461. Ordinary one-way ANOVA performed.

