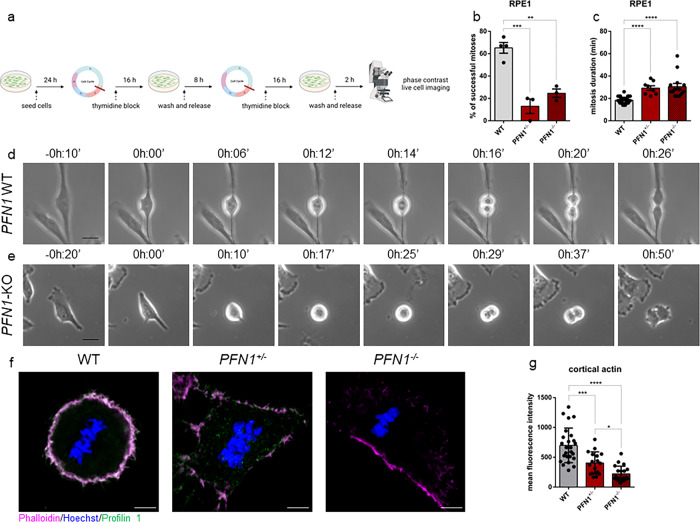
Fig. 3. Profilin 1 knock-out induces prolonged mitosis.
a Schematic of the experiment created in BioRender (https://biorender.com/) by F.S.d.C. as a registered user. b Percentage of cells able to complete mitosis following the round up; data are shown as mean ± s.e.m.; dots represent the mean for each experiment (n = 67 WT, 44 PFN1+/−, 43 PFN1−/− RPE1 cells; range of number of cells used for each individual experiment: 9-25 WT, 13-16 PFN1+/−, 11-16 PFN1−/−); ***P = 0.0005, **P = 0.0023. The mean difference between PFN1+/− and PFN1−/− cells was not statistically significant (P = 0.4310). c Time taken from start (cell rounding) to end (cytokinesis) of mitosis; data are shown as mean ± s.e.m.; dots represent the duration of each cell division expressed in minutes (n mitoses = 39 WT, 8 PFN1+/−, 14 PFN1−/− RPE1 cells); ****P < 0.0001. Data in b and c were analysed by ordinary one-way ANOVA. d Representative time-lapse phase-contrast images (taken every 2 min) of WT and e PFN1-KO RPE1 cells; scale bars 25 μm. Time stamps indicate elapsed time in hours:minutes. f WT, PFN1+/− and PFN1−/− RPE1 cells at metaphase stained for DNA (Hoechst 33342, blue), Profilin 1 (green) and F-actin (phalloidin, magenta); scale bars 5 μm. g Mean fluorescence intensity of cortical actin; data are shown as mean ± s.e.m.; dots represent the fluorescent intensity for each sample (n = 25 for WT, 17 for PFN1+/−, 20 for PFN1−/− cells); ***P = 0.0002, ****P < 0.0001, *P = 0.0436. Ordinary one-way ANOVA performed.

