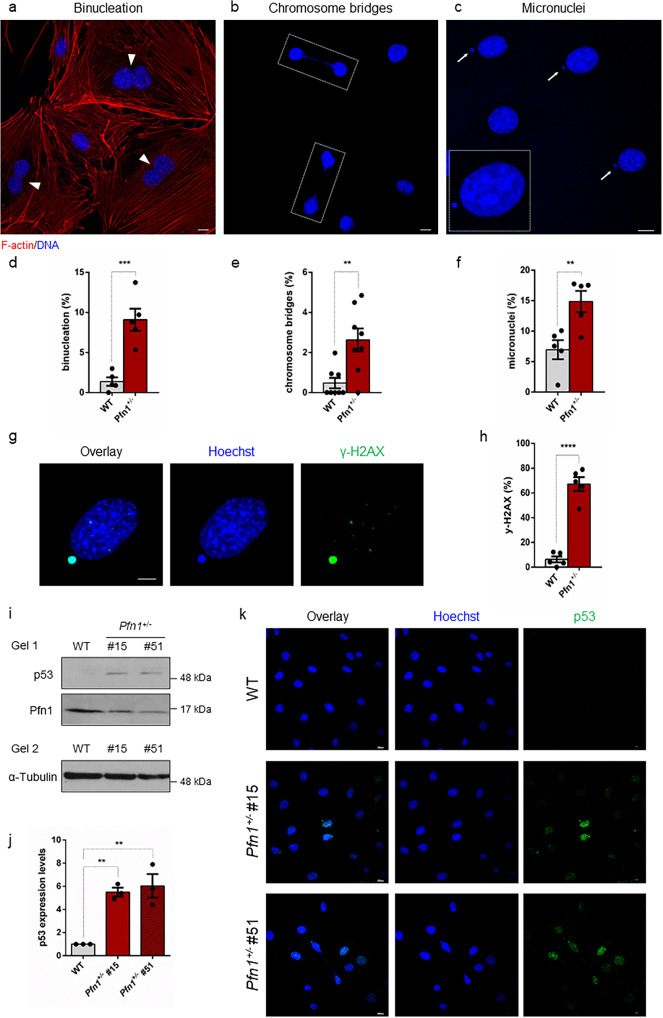
Fig. 5. Profilin 1 deficiency is associated with nuclear abnormalities and DNA damage.
Representative confocal images of Pfn1+/− MC3T3 cells subjected to phalloidin (F-actin, red) and Hoechst 33342 (nucleus, blue) staining, showing nuclear abnormalities: a binucleated cells are indicated by arrowheads; b dashed lines indicate chromosome bridges connecting two cells; c micronuclei are indicated by white arrows; scale bars 10 µm. d Quantification (%) of binucleated cells; data are shown as mean ± s.e.m.; dots represent the value of each experiment (n = 508 WT and 479 KO cells; range of number of cells used for each individual experiment: 94-112 WT, 89-103 Pfn1+/−); ***P = 0.0004. e Quantification (%) of cells with chromosome bridges; data are shown as mean ± s.e.m.; dots represent the value of each experiment (n = 800 WT and 771 KO cells; range of number of cells used for each individual experiment: 88-112 WT, 89-111 Pfn1+/−); **P = 0.0021. f Quantification (%) of micronucleated cells; data are shown as mean ± s.e.m.; dots represent the value of each experiment (n = 485 WT and 496 KO cells; range of number of cells used for each individual experiment: 74-119 WT, 89-111 Pfn1+/−); **P = 0.0049. g Confocal image of a micronucleated Pfn1+/− MC3T3 cell stained for DNA (Hoechst 33342, blue) and γ-H2AX (green); scale bar 5 µm. h The mean percentage of cells positive to γ-H2AX is shown as mean ± s.e.m.; dots represent the value of each experiment (n = 169 WT and 324 KO micronucleated cells; range of number of cells used for each individual experiment: 17-47 WT, 38-82 Pfn1+/−); ****P < 0.0001. Data in d–f, h were analysed by one-tailed unpaired Student’s t-tests; results from Pfn1+/− cell clones (#15 and #51) were grouped into one data set. i Western blotting analysis of WT and 2 different Pfn1+/− MC3T3 clones (#15 and #51) showing p53 accumulation. Due to similar molecular weight of ~50 kDa between p53 and α-Tubulin, the same amount of protein was loaded two times on the same gel, and α-Tubulin was used as loading control. j Quantification of p53 normalised to α-Tubulin; bars represent mean ± s.e.m.; dots represent the mean for each experiment (n = 3 from two independent protein extracts); **P = 0.0041, **P = 0.0023. Ordinary one-way ANOVA test performed. k Confocal images of p53 nuclear localisation in WT and Pfn1+/− clones (#15 and #51). DNA is stained with Hoechst 33342 (blue); scale bars 10 µm.

