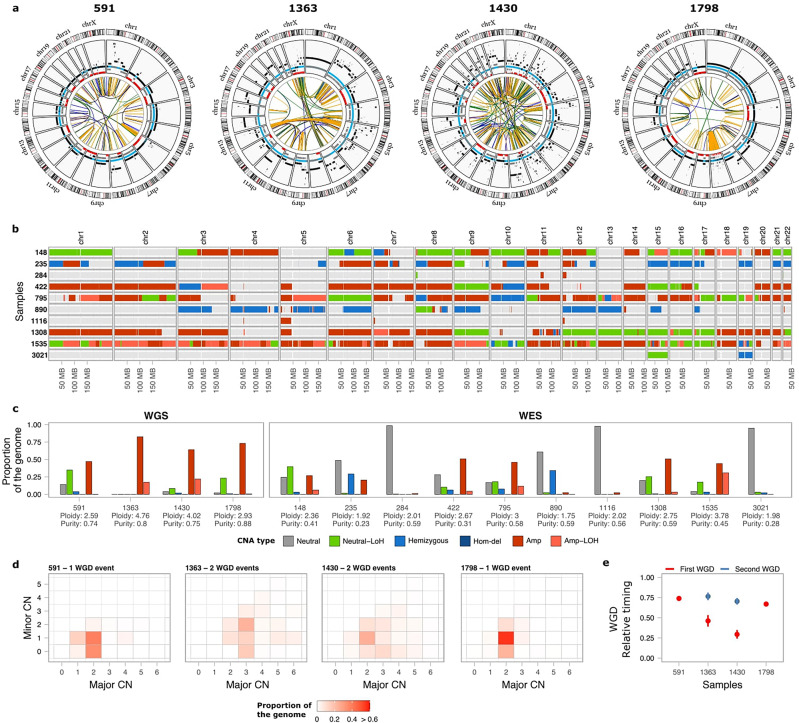
Fig. 7. Somatic genomic landscape of 14 OS/PDB patients.
a Circos plots for 4 OS/PDB patients analysed using whole-genome sequencing. The inner circle shows somatic SVs coloured according to the type of SV (duplication-like, deletion-like, head-to-head and tail-to-tail inversions are shown in blue, orange, black and green, respectively). The second circle shows SCNAs, with black representing the total copy number, grey the minor copy number, and red the minor copy number when equal to 0. Blue segments mark the expected normal diploid state (CN = 2) as a reference for visualisation. b SCNA calls for the 10 WES OS/PDB patients. The colour of the bars represents the different types of SCNAs. c Proportion of the genome affected by each type of SCNA. d Heatmap of the proportion of the genome representing the different combinations of the obtained major and minor copy numbers in the WGS samples used to estimate the number of WGD events. e Relative timing analysis of the WGD events for the WGS samples. The colour of the dots represents the first (red) and second (blue) WGS events for each sample. Lines represent the 95% confidence intervals after bootstrapping 1000 times. Neutral: total copy number = 2 and minor copy number = 1; Neutral-LoH: total copy number = 2 and minor copy number = 0; Hemizygous: total copy number = 1; Hom-del: homozygous deletion; Amp-LoH: total copy number > 2 and minor copy number = 0.

