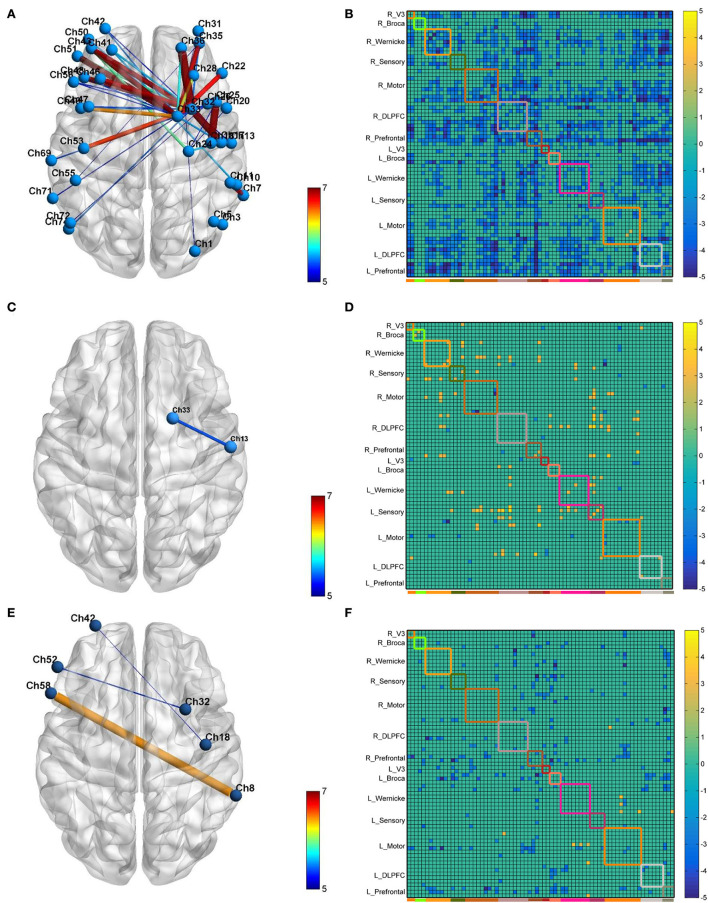
Figure 4.
The 3D brain visualization of the difference in the connectivity after CB-SMA (A) protocol, CB-M1 protocol (C), and CB-single (E). The FC Matrix of different connections between post- and pre-iTBS intervention in CB-SMA group (B), CB-M1 group (D) and CB-single (F). Significant connections (p < 0.05, FDR corrected) after paired t-test are colored contrast to background color according to T-values. Subnets and within connections are highlighted by rectangle.

