
Figure 4.
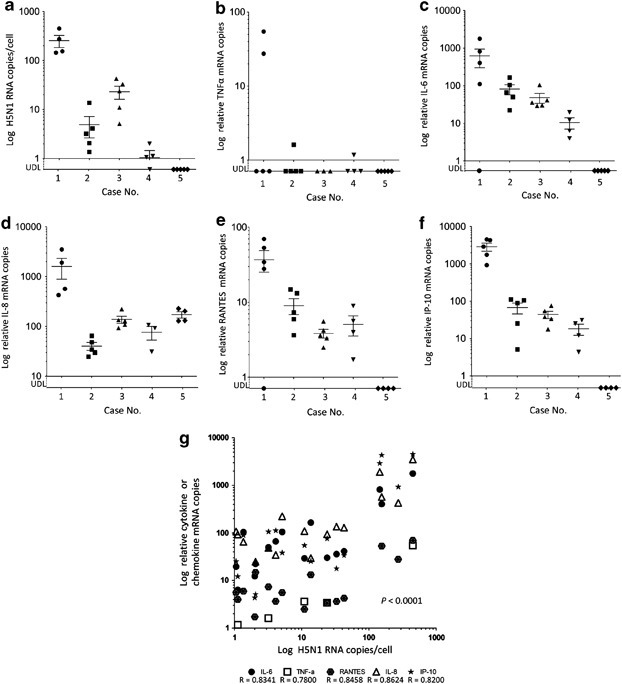
H5N1 RNA and proinflammatory cytokine or chemokine expression levels in several lung regions. The x axis indicates the case number. The durations of disease for cases 1, 2, 3, 4 and 5 were 8, 10, 13, 16 and 18 days, respectively. The y axis indicates H5N1 RNA (a), tumor necrosis factor-alpha (TNF-α) (b), interleukin (IL)-6 (c), IL-8 (d), regulated on activation normal T-cell expressed and secreted (RANTES) (e) and interferon-gamma-inducible protein of 10 kDa (IP-10) (f) mRNA copy numbers on a logarithmic scale. •, case 1; ▪, case 2; ▴, case 3; ▾, case 4; and ♦, case 5. (g) Correlation between copy numbers of H5N1 RNA and cytokine or chemokine mRNA in lung tissue. Data from the five cases (a–f) were combined, with any values below the limit of detection (UDL) excluded. The horizontal lines indicate the mean, and vertical error bars indicate the mean±s.d., P<0.0001.