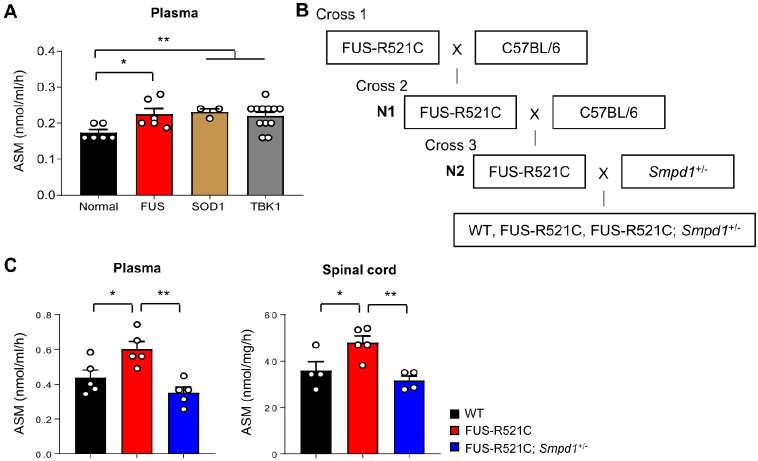
Fig. 1.
ASM activity increases in the plasma of ALS patients and both the plasma and spinal cords of ALS model mice; its activity decreases after genetic inhibition of ASM in ALS mice. (A) ASM activity in plasma of normal and ALS patients (n = 3-12 per group). (B) A schematic diagram showing the strategy used for generating FUS-R521C; Smpd1+/− mice. (C) ASM activity in the plasma and spinal cord of wild type (WT), FUS-R521C, and FUS-R521C; Smpd1+/− mice (n = 4-5 per group). One-way analysis of variance, Tukey’s post hoc test. *P < 0.05, **P < 0.01. All error bars indicate S.E.M. All data analysis was done on 12-week-old mice.

