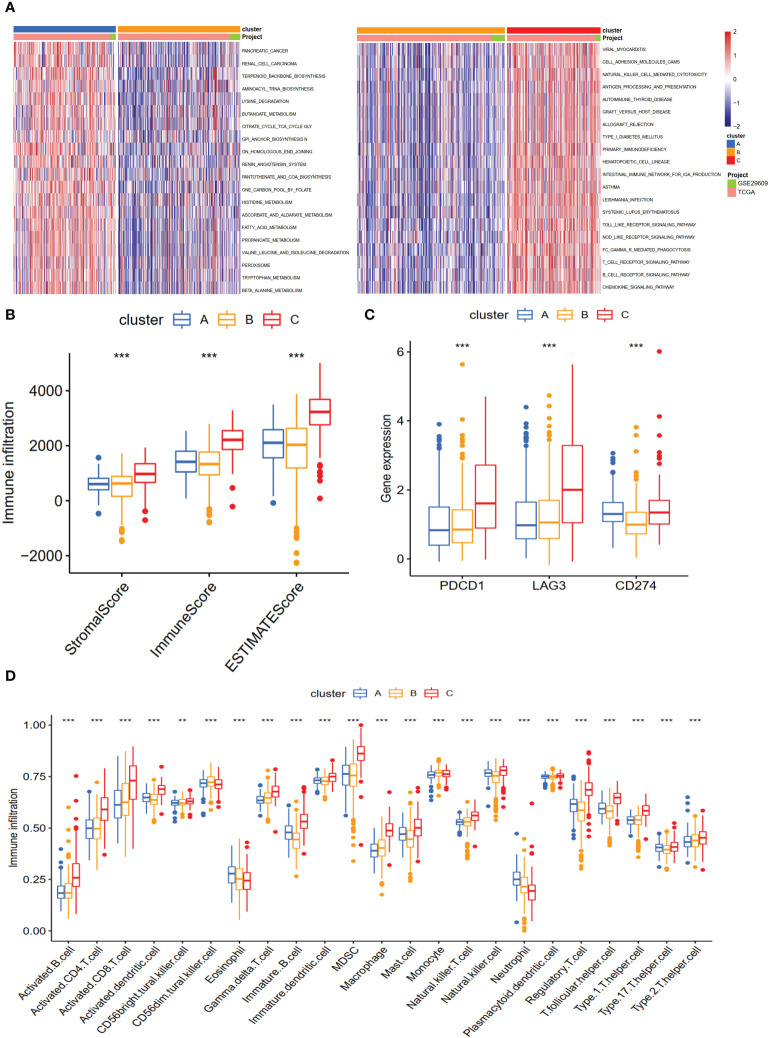
Figure 3.
The biological characteristics and landscape of immune status among different subtypes. (A) KEGG enrichment analysis of three NET subtypes. (B) The ESTIMATE proportion of stromal score, immune score, and ESTIMATE score among the three clusters. (C) The gene expression profiles of three common immune checkpoint genes, PDCD1, LAG3, and CD274. (D) The infiltration levels of 23 immune cell types among three subtypes. **p < 0.01, ***p < 0.001.

