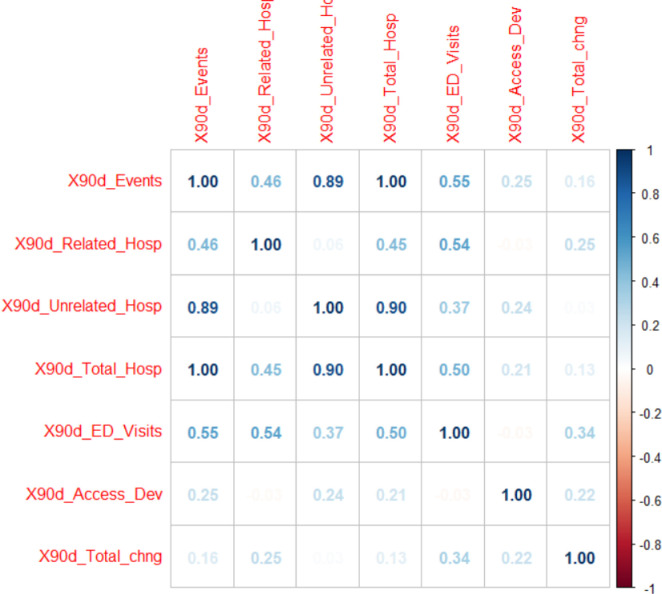
Figure 3.
Correlation Plot. Correlation plot of Spearman correlation to show relationships of seven count variables in the data file (with only study and case–control group patients). X90d_Events = total 90-day adverse events, X90d_Related_Hosp = 90-day hospitalisations related to therapy, X90d_Unrelated_Hosp = 90-day hospitalisations unrelated to therapy, X90d_Total_Hosp = 90-day total number of hospitalisations, X90d_ED_Visits = 90-day emergency department visits, X90d_Access_Dev = 90-day access device complications. ED, emergency department.

