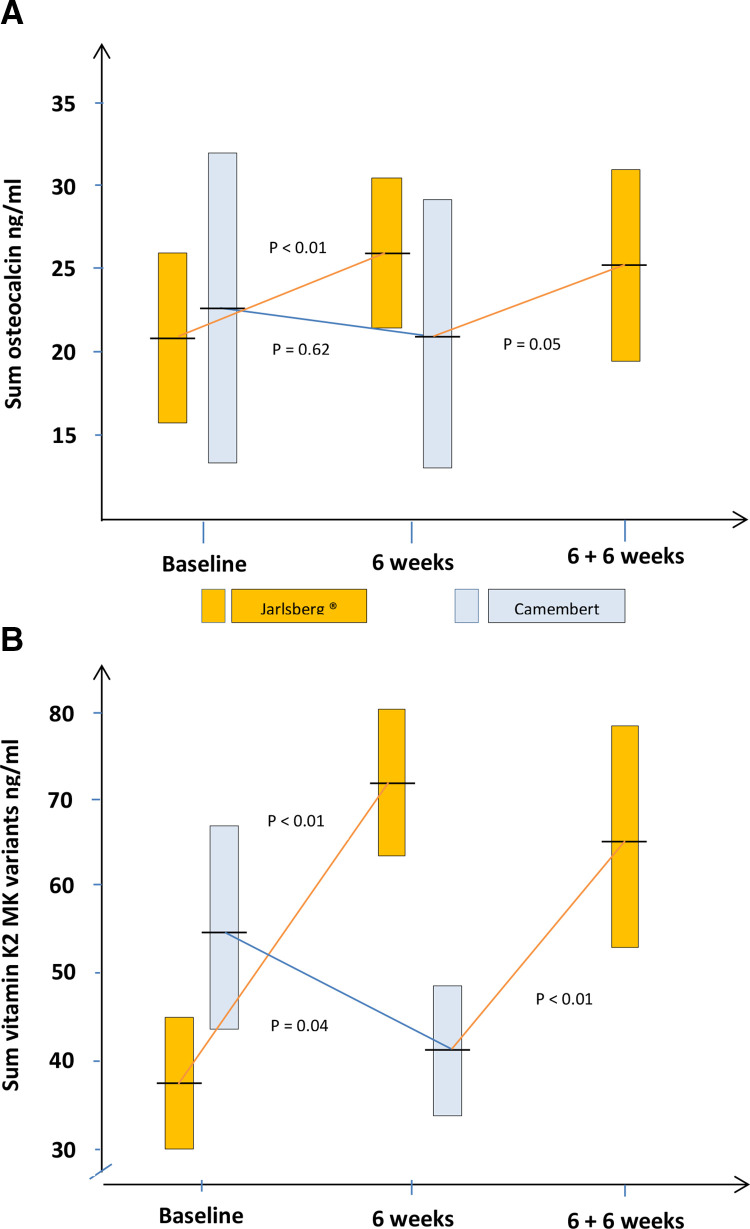
Figure 1.
Development within- and comparison between cheese groups on (A) total serum osteocalcin and (B) Sum vitamin K2 vitamers. The yellow boxes show 95% confidence intervals of the mean in the Jarlsberg treated group and the blue similarly in the Camembert group. The mean values are given as horizontal lines crossing the boxes.

