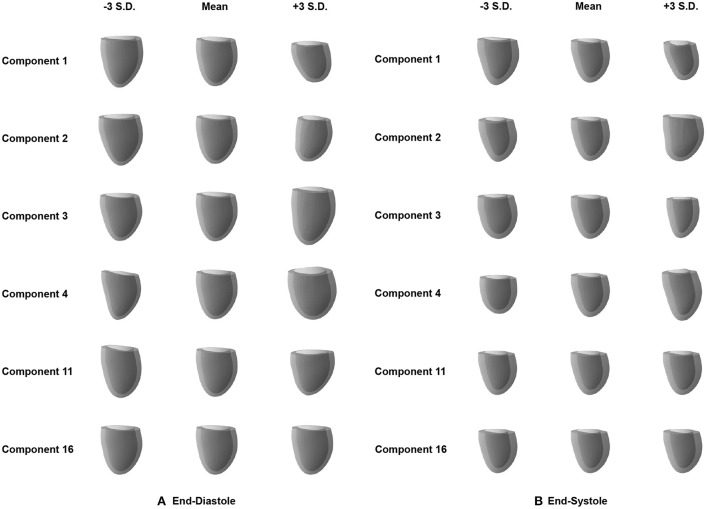
Figure 5.
Effect of changes in the individual latent space components (rows) on the 3D mesh shapes reconstructed by the decoder of the mesh VAE for ED (A) and ES (B) phases. Results are shown for the four most active latent space components (1–4), the least active one (16), and the one with the largest activity difference between ED and ES phases (11).

