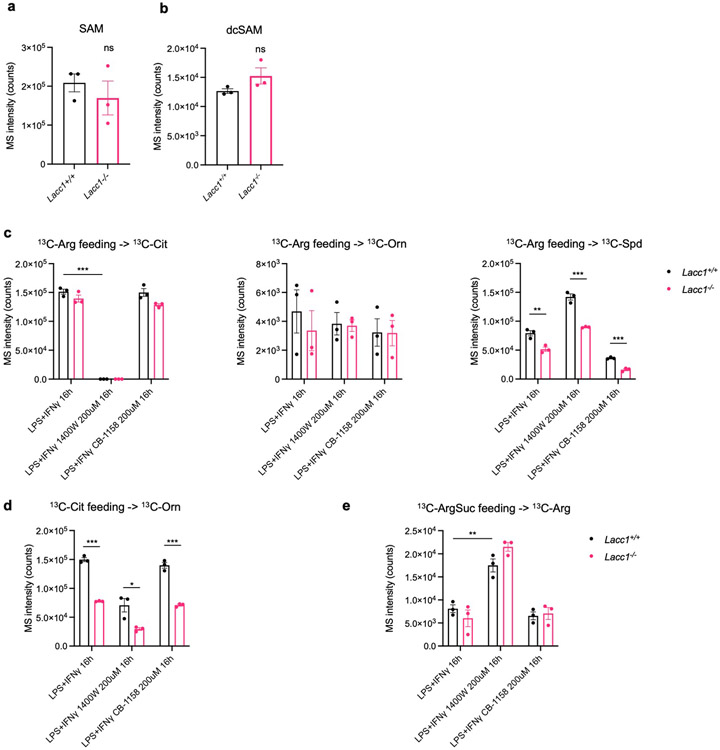
Extended Data Fig. 5.
LACC1 bridges L-Arg metabolism with polyamine synthesis in inflammatory macrophages. a, b, MS intensity of SAM and dcSAM, respectively, in inflammatory BMDMs from WT and Lacc1−/− mice. Lacc1−/− BMDMs show an elevated but non statistically significant level of dcSAM. c-e, UPLC-QTOF-MS intensity of 13C-labeled metabolites in L-Arg metabolism and polyamine synthesis with 13C-Arg feeding (c), 13C-Cit feeding (d) and 13C-ArgSuc feeding (e), respectively. These data complement LC-QQQ-MS experimental measurements shown in Fig. 3a. The mean and SEM (error bars) are derived from three biological replicates (n = 3). Statistical significance (two-tailed t-test) compared to control (Ctrl): *P<0.05; **P<0.01; ***P<0.001; ns, not significant.

