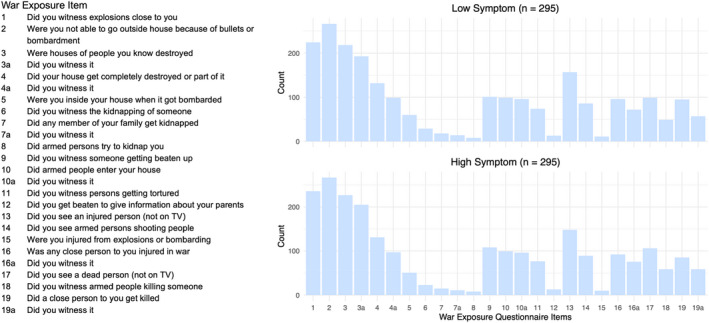
Figure 1.

War exposure questionnaire response pattern in matched groups. Bar chart showing the number of children who reportedly experienced each war event from the matched Low and High Symptom groups. Note: Items displayed in the table to the left correspond to the item numbers on the bar chart [Color figure can be viewed at wileyonlinelibrary.com]
